General Motors 2013 Annual Report Download - page 102
Download and view the complete annual report
Please find page 102 of the 2013 General Motors annual report below. You can navigate through the pages in the report by either clicking on the pages listed below, or by using the keyword search tool below to find specific information within the annual report.-
 1
1 -
2
-
3
-
4
-
5
-
6
-
7
-
8
-
9
-
10
-
11
-
12
-
13
-
14
-
15
-
16
-
17
-
18
-
19
-
20
-
21
-
22
-
23
-
24
-
25
-
26
-
27
-
28
-
29
-
30
-
31
-
32
-
33
-
34
-
35
-
36
-
37
-
38
-
39
-
40
-
41
-
42
-
43
-
44
-
45
-
46
-
47
-
48
-
49
-
50
-
51
-
52
-
53
-
54
-
55
-
56
-
57
-
58
-
59
-
60
-
61
-
62
-
63
-
64
-
65
-
66
-
67
-
68
-
69
-
70
-
71
-
72
-
73
-
74
-
75
-
76
-
77
-
78
-
79
-
80
-
81
-
82
-
83
-
84
-
85
-
86
-
87
-
88
-
89
-
90
-
91
-
 92
92 -
 93
93 -
 94
94 -
 95
95 -
 96
96 -
 97
97 -
 98
98 -
 99
99 -
 100
100 -
 101
101 -
 102
102 -
 103
103 -
 104
104 -
 105
105 -
 106
106 -
 107
107 -
 108
108 -
 109
109 -
 110
110 -
 111
111 -
 112
112 -
113
-
114
-
115
-
116
-
117
-
118
-
119
-
120
-
121
-
122
-
123
-
124
-
125
-
126
-
127
-
128
-
129
-
130
 |
 |

GENERAL MOTORS COMPANY AND SUBSIDIARIES
NOTES TO CONSOLIDATED FINANCIAL STATEMENTS — (Continued)
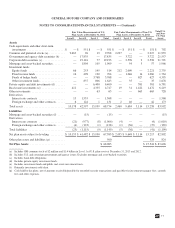
The following tables summarize the activity for U.S. plan assets measured at fair value using Level 3 inputs (dollars in millions):
Balance at
January 1,
2013
Net Realized/
Unrealized
Gains (Losses)
Purchases,
Sales and
Settlements,
Net
Transfers
Into/
Out
of Level 3
Balance at
December 31,
2013
Change in
Unrealized
Gains/(Losses)
Attributable to
Assets Held at
December 31,
2013
Assets
Common and preferred stocks .................. $ 19 $ 3 $ (16) $ — $ 6 $ 1
Corporate debt securities ....................... 77 5 (24) — 58 (2)
Mortgage and asset-backed securities ............. 105 1 (34) — 72 (1)
Investment funds
Equity funds .............................. 195 (3) (148) — 44 —
Fixed income funds ......................... 190 17 (94) — 113 11
Funds of hedge funds ....................... 3,768 498 19 — 4,285 497
Other investment funds ...................... 806 40 (114) — 732 29
Private equity and debt investments .............. 6,400 926 (991) — 6,335 436
Real estate investments ........................ 4,335 458 (666) — 4,127 190
Other investments ............................ 63 (2) 1 — 62 (2)
Total assets ................................. 15,958 1,943 (2,067) — 15,834 1,159
Derivatives, net
Interest rate contracts ....................... (8) 2 — — (6) 1
Total net assets .............................. $ 15,950 $ 1,945 $ (2,067) $ — $ 15,828 $ 1,160
Balance at
January 1,
2012
Net Realized/
Unrealized
Gains (Losses)
Purchases,
Sales and
Settlements,
Net
Transfers
Into/
Out
of Level 3
Balance at
December 31,
2012
Change in
Unrealized
Gains/(Losses)
Attributable to
Assets Held at
December 31,
2012
Assets
Common and preferred stocks .................. $ 46 $ 1 $ (25) $ (3) $ 19 $ 3
Government and agency debt securities ........... 3 (1) (2) — — —
Corporate debt securities ....................... 352 1 (258) (18) 77 (35)
Mortgage and asset-backed securities ............. 197 34 (120) (6) 105 24
Group annuity contracts ....................... 3,209 77 (3,286) — — —
Investment funds
Equity funds .............................. 521 51 (414) 37 195 18
Fixed income funds ......................... 1,210 47 (1,067) — 190 (3)
Funds of hedge funds ....................... 5,918 310 (2,460) — 3,768 239
Other investment funds ...................... 2,270 55 (1,531) 12 806 (2)
Private equity and debt investments .............. 8,444 1,022 (3,038) (28) 6,400 154
Real estate investments ........................ 5,092 198 (955) — 4,335 (80)
Other investments ............................ — — 63 — 63 —
Total assets ................................. 27,262 1,795 (13,093) (6) 15,958 318
Derivatives, net
Interest rate contracts ....................... 7 3 (14) (4) (8) (1)
Foreign exchange and other contracts ........... (6) 1 5 — — —
Total net assets .............................. $ 27,263 $ 1,799 $ (13,102) $ (10) $ 15,950 $ 317
100
2013 ANNUAL REPORT