General Motors 2013 Annual Report Download - page 103
Download and view the complete annual report
Please find page 103 of the 2013 General Motors annual report below. You can navigate through the pages in the report by either clicking on the pages listed below, or by using the keyword search tool below to find specific information within the annual report.-
 1
1 -
2
-
3
-
4
-
5
-
6
-
7
-
8
-
9
-
10
-
11
-
12
-
13
-
14
-
15
-
16
-
17
-
18
-
19
-
20
-
21
-
22
-
23
-
24
-
25
-
26
-
27
-
28
-
29
-
30
-
31
-
32
-
33
-
34
-
35
-
36
-
37
-
38
-
39
-
40
-
41
-
42
-
43
-
44
-
45
-
46
-
47
-
48
-
49
-
50
-
51
-
52
-
53
-
54
-
55
-
56
-
57
-
58
-
59
-
60
-
61
-
62
-
63
-
64
-
65
-
66
-
67
-
68
-
69
-
70
-
71
-
72
-
73
-
74
-
75
-
76
-
77
-
78
-
79
-
80
-
81
-
82
-
83
-
84
-
85
-
86
-
87
-
88
-
89
-
90
-
91
-
92
-
 93
93 -
 94
94 -
 95
95 -
 96
96 -
 97
97 -
 98
98 -
 99
99 -
 100
100 -
 101
101 -
 102
102 -
 103
103 -
 104
104 -
 105
105 -
 106
106 -
 107
107 -
 108
108 -
 109
109 -
 110
110 -
 111
111 -
 112
112 -
 113
113 -
114
-
115
-
116
-
117
-
118
-
119
-
120
-
121
-
122
-
123
-
124
-
125
-
126
-
127
-
128
-
129
-
130
 |
 |

GENERAL MOTORS COMPANY AND SUBSIDIARIES
NOTES TO CONSOLIDATED FINANCIAL STATEMENTS — (Continued)
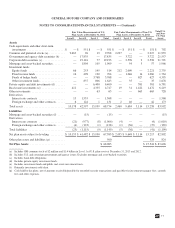
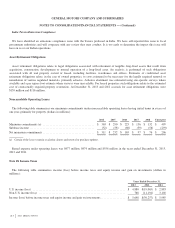
The following tables summarize the activity for non-U.S. plan assets measured at fair value using Level 3 inputs (dollars in
millions):
Balance at
January 1,
2013
Net Realized/
Unrealized
Gains (Losses)
Purchases,
Sales and
Settlements,
Net
Transfers
Into/Out of
Level 3
Effect of
Foreign
Currency
Balance at
December 31,
2013
Change in
Unrealized
Gains/(Losses)
Attributable to
Assets Held at
December 31,
2013
Assets
Corporate debt securities .............. $ 2 $ 1 $ 8 $ 1 $ — $ 12 $ 1
Mortgage and asset-backed securities .... 3 — (1) — — 2 —
Investment funds
Fixed income funds ................ 14 (1) (1) — — 12 —
Funds of hedge funds ............... 627 111 28 — (33) 733 112
Private equity and debt investments ...... 381 73 3 — (27) 430 53
Real estate investments ............... 1,422 103 (57) — (63) 1,405 122
Other investments .................... 665 (10) (43) — 6 618 4
Total assets ......................... $ 3,114 $ 277 $ (63) $ 1 $ (117) $ 3,212 $ 292
Balance at
January 1,
2012
Net Realized/
Unrealized
Gains (Losses)
Purchases,
Sales and
Settlements,
Net
Transfers
Into/Out of
Level 3
Effect of
Foreign
Currency
Balance at
December 31,
2012
Change in
Unrealized
Gains/(Losses)
Attributable to
Assets Held at
December 31,
2012
Assets
Government and agency debt securities . . . $ 1 $ — $ (1) $ — $ — $ — $ —
Corporate debt securities .............. 4 2 (4) — — 2 —
Mortgage and asset-backed securities .... 4 — (4) 3 — 3 —
Investment funds
Equity funds ...................... 146 (24) (124) — 2 — —
Fixed income funds ................ 20 — (6) — — 14 —
Funds of hedge funds ............... 585 25 — — 17 627 26
Other investment funds ............. 247 17 (269) — 5 — —
Private equity and debt investments ...... 298 46 29 — 8 381 24
Real estate investments ............... 1,345 123 (82) — 36 1,422 119
Other investments .................... 428 16 203 — 18 665 10
Total assets ......................... $ 3,078 $ 205 $ (258) $ 3 $ 86 $ 3,114 $ 179
Investment Fund Strategies
Equity funds include funds that invest in U.S. common and preferred stocks as well as similar equity securities issued by companies
incorporated, listed or domiciled in developed and/or emerging markets countries.
Fixed income funds include investments in high quality and high yield funds as well as in credit arbitrage funds. High quality fixed
income funds invest in government securities, investment-grade corporate bonds, mortgages and asset-backed securities. High yield
fixed income funds invest in high yield fixed income securities issued by corporations which are rated below investment grade, are
unrated but are believed by the investment manager to have similar risk characteristics or are rated investment grade or higher but are
priced at yields comparable to securities rated below investment grade and believed to have similar risk characteristics. Credit
101