General Motors 2013 Annual Report Download - page 127
Download and view the complete annual report
Please find page 127 of the 2013 General Motors annual report below. You can navigate through the pages in the report by either clicking on the pages listed below, or by using the keyword search tool below to find specific information within the annual report.-
 1
1 -
2
-
3
-
4
-
5
-
6
-
7
-
8
-
9
-
10
-
11
-
12
-
13
-
14
-
15
-
16
-
17
-
18
-
19
-
20
-
21
-
22
-
23
-
24
-
25
-
26
-
27
-
28
-
29
-
30
-
31
-
32
-
33
-
34
-
35
-
36
-
37
-
38
-
39
-
40
-
41
-
42
-
43
-
44
-
45
-
46
-
47
-
48
-
49
-
50
-
51
-
52
-
53
-
54
-
55
-
56
-
57
-
58
-
59
-
60
-
61
-
62
-
63
-
64
-
65
-
66
-
67
-
68
-
69
-
70
-
71
-
72
-
73
-
74
-
75
-
76
-
77
-
78
-
79
-
80
-
81
-
82
-
83
-
84
-
85
-
86
-
87
-
88
-
89
-
90
-
91
-
92
-
93
-
94
-
95
-
96
-
97
-
98
-
99
-
100
-
101
-
102
-
103
-
104
-
105
-
106
-
107
-
108
-
109
-
110
-
111
-
112
-
113
-
114
-
115
-
116
-
 117
117 -
 118
118 -
 119
119 -
 120
120 -
 121
121 -
 122
122 -
 123
123 -
 124
124 -
 125
125 -
 126
126 -
 127
127 -
 128
128 -
 129
129 -
 130
130
 |
 |
GENERAL MOTORS COMPANY AND SUBSIDIARIES
NOTES TO CONSOLIDATED FINANCIAL STATEMENTS — (Continued)
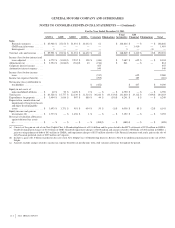
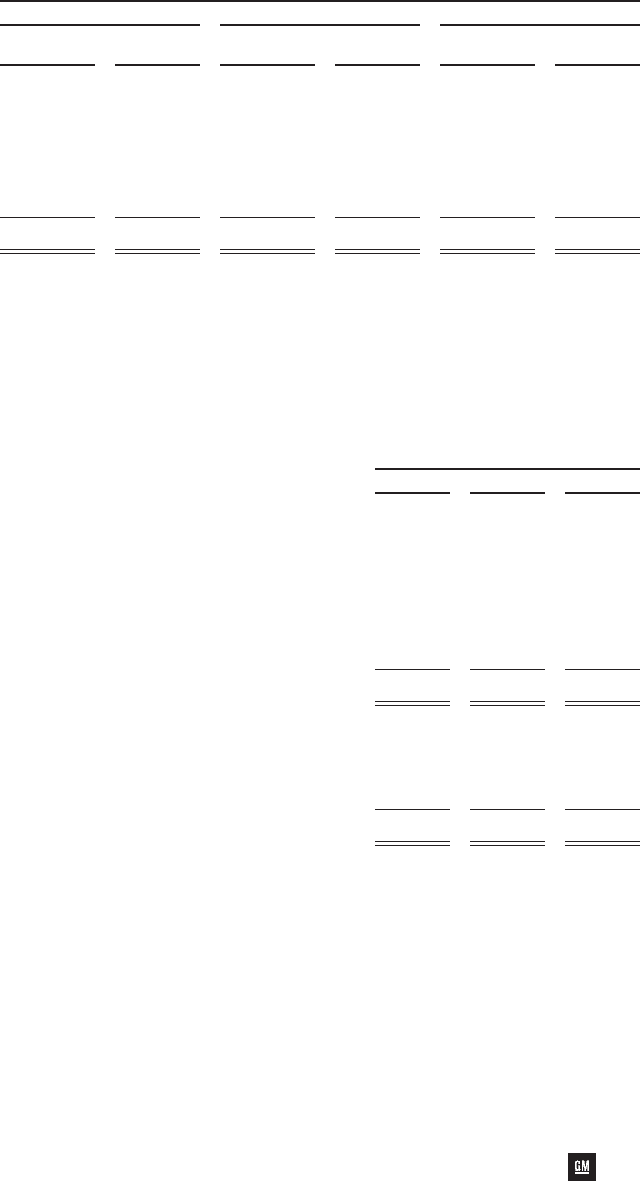
Automotive revenue is attributed to geographic areas based on the country in which our subsidiary is located. Automotive
Financing revenue is attributed to the geographic area where the financing is originated. The following table summarizes information
concerning principal geographic areas (dollars in millions):
At and For the Years Ended December 31,
2013 2012 2011
Net Sales &
Revenue
Long-Lived
Assets
Net Sales &
Revenue
Long-Lived
Assets
Net Sales &
Revenue
Long-Lived
Assets
Automotive
U.S. .................................... $ 88,784 $ 15,844 $ 85,105 $ 13,520 $ 79,868 $ 11,736
Non-U.S. ................................ 63,308 12,289 65,190 12,425 68,998 13,709
GM Financial
U.S. .................................... 2,233 2,472 1,832 1,112 1,363 532
Non-U.S. ................................ 1,102 1,043 129 590 47 300
Total consolidated ........................... $ 155,427 $ 31,648 $ 152,256 $ 27,647 $ 150,276 $ 26,277
No individual country other than the U.S. represented more than 10% of our total Net sales and revenue or Long-lived assets.
Note 26. Supplemental Information for the Consolidated Statements of Cash Flows
The following table summarizes the sources (uses) of cash provided by Change in other operating assets and liabilities and cash
paid for income taxes and interest (dollars in millions):
Years Ended December 31,
2013 2012 2011
Accounts receivable ............................................................... $ 8 $ (460) $ (1,572)
Inventories ...................................................................... 59 (326) (2,760)
Automotive equipment on operating leases ............................................. (968) 370 (522)
Change in other assets ............................................................. (563) (312) (320)
Accounts payable ................................................................. (485) 162 2,139
Income taxes payable .............................................................. (161) 155 (360)
Accrued liabilities and other liabilities ................................................ 784 1,041 (727)
Total ........................................................................... $ (1,326) $ 630 $ (4,122)
Cash paid for income taxes and interest
Cash paid for income taxes ......................................................... $ 727 $ 575 $ 569
Cash paid for interest (net of amounts capitalized) — Automotive .......................... $ 299 $ 335 $ 226
Cash paid for interest (net of amounts capitalized) — GM Financial ......................... 760 298 284
Total cash paid for interest (net of amounts capitalized) ................................... $ 1,059 $ 633 $ 510
*******
125