General Motors 2013 Annual Report Download - page 89
Download and view the complete annual report
Please find page 89 of the 2013 General Motors annual report below. You can navigate through the pages in the report by either clicking on the pages listed below, or by using the keyword search tool below to find specific information within the annual report.-
 1
1 -
2
-
3
-
4
-
5
-
6
-
7
-
8
-
9
-
10
-
11
-
12
-
13
-
14
-
15
-
16
-
17
-
18
-
19
-
20
-
21
-
22
-
23
-
24
-
25
-
26
-
27
-
28
-
29
-
30
-
31
-
32
-
33
-
34
-
35
-
36
-
37
-
38
-
39
-
40
-
41
-
42
-
43
-
44
-
45
-
46
-
47
-
48
-
49
-
50
-
51
-
52
-
53
-
54
-
55
-
56
-
57
-
58
-
59
-
60
-
61
-
62
-
63
-
64
-
65
-
66
-
67
-
68
-
69
-
70
-
71
-
72
-
73
-
74
-
75
-
76
-
77
-
78
-
 79
79 -
 80
80 -
 81
81 -
 82
82 -
 83
83 -
 84
84 -
 85
85 -
 86
86 -
 87
87 -
 88
88 -
 89
89 -
 90
90 -
 91
91 -
 92
92 -
 93
93 -
 94
94 -
 95
95 -
 96
96 -
 97
97 -
 98
98 -
 99
99 -
100
-
101
-
102
-
103
-
104
-
105
-
106
-
107
-
108
-
109
-
110
-
111
-
112
-
113
-
114
-
115
-
116
-
117
-
118
-
119
-
120
-
121
-
122
-
123
-
124
-
125
-
126
-
127
-
128
-
129
-
130
 |
 |

GENERAL MOTORS COMPANY AND SUBSIDIARIES
NOTES TO CONSOLIDATED FINANCIAL STATEMENTS — (Continued)
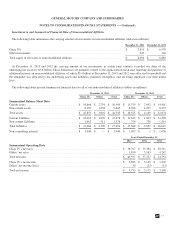
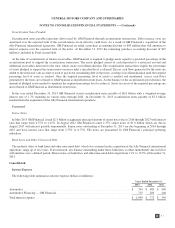
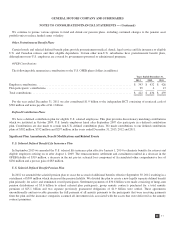
The following table summarizes activity for policy, product warranty and recall campaigns (dollars in millions):
Years Ended December 31,
2013 2012 2011
Beginning balance ................................................................ $ 7,204 $ 6,600 $ 6,789
Warranties issued and assumed in period .............................................. 3,181 3,394 3,062
Payments ....................................................................... (3,063) (3,393) (3,740)
Adjustments to pre-existing warranties ................................................ 123 539 565
Effect of foreign currency and other .................................................. (231) 64 (76)
Ending balance ................................................................... $ 7,214 $ 7,204 $ 6,600
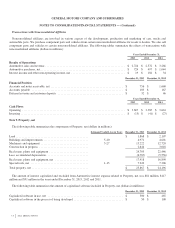
Note 14. Short-Term and Long-Term Debt
Automotive
The following table summarizes the components of our short-term debt and long-term debt (dollars in millions):
December 31, 2013 December 31, 2012
Secured debt ................................................................... $ 320 $ 1,182
Unsecured debt .................................................................
Senior unsecured notes ......................................................... 4,500 —
Canadian Health Care Trust (HCT) notes ........................................... — 1,239
Other unsecured debt ........................................................... 1,352 1,713
Total unsecured debt ............................................................. 5,852 2,952
Capital leases ................................................................... 965 1,038
Total automotive debt (a) ......................................................... 7,137 5,172
Less: short-term debt and current portion of long-term debt .............................. 564 1,748
Total long-term debt ............................................................. $ 6,573 $ 3,424
Fair value of automotive debt (b) ................................................... $ 6,837 $ 5,298
Available under credit facility agreements ............................................ $ 10,404 $ 11,119
Interest rate range on outstanding debt (c) ............................................ 0.0-19.0% 0.0-19.0%
Weighted-average interest rate on outstanding short-term debt (c) ......................... 9.0% 3.7%
Weighted-average interest rate on outstanding long-term debt (c) .......................... 3.8% 4.0%
(a) Net of a $765 million and $1.1 billion net discount at December 31, 2013 and 2012.
(b) The fair value of debt includes $6.8 billion and $4.1 billion measured utilizing Level 2 inputs at December 31, 2013 and 2012 and $1.2 billion
measured utilizing Level 3 inputs at December 31, 2012.
(c) Includes coupon rates on debt denominated in various foreign currencies and interest free loans.
The Level 2 fair value measurements utilize quoted market prices and if unavailable, a discounted cash flow model. The valuation
is reviewed internally by personnel with appropriate expertise in valuation methodologies. This model utilizes observable inputs such
as contractual repayment terms and benchmark yield curves, plus a spread that is intended to represent our nonperformance risk for
secured or unsecured obligations. We estimate our nonperformance risk using our corporate credit rating, the ratings on our senior
unsecured notes and on our secured revolver, yields on traded bonds of companies with comparable credit ratings and risk profiles.
We acquire the benchmark yield curves and nonperformance risk spread from independent sources that are widely used in the
87