General Motors 2013 Annual Report Download - page 47
Download and view the complete annual report
Please find page 47 of the 2013 General Motors annual report below. You can navigate through the pages in the report by either clicking on the pages listed below, or by using the keyword search tool below to find specific information within the annual report.-
 1
1 -
2
-
3
-
4
-
5
-
6
-
7
-
8
-
9
-
10
-
11
-
12
-
13
-
14
-
15
-
16
-
17
-
18
-
19
-
20
-
21
-
22
-
23
-
24
-
25
-
26
-
27
-
28
-
29
-
30
-
31
-
32
-
33
-
34
-
35
-
36
-
 37
37 -
 38
38 -
 39
39 -
 40
40 -
 41
41 -
 42
42 -
 43
43 -
 44
44 -
 45
45 -
 46
46 -
 47
47 -
 48
48 -
 49
49 -
 50
50 -
 51
51 -
 52
52 -
 53
53 -
 54
54 -
 55
55 -
 56
56 -
 57
57 -
58
-
59
-
60
-
61
-
62
-
63
-
64
-
65
-
66
-
67
-
68
-
69
-
70
-
71
-
72
-
73
-
74
-
75
-
76
-
77
-
78
-
79
-
80
-
81
-
82
-
83
-
84
-
85
-
86
-
87
-
88
-
89
-
90
-
91
-
92
-
93
-
94
-
95
-
96
-
97
-
98
-
99
-
100
-
101
-
102
-
103
-
104
-
105
-
106
-
107
-
108
-
109
-
110
-
111
-
112
-
113
-
114
-
115
-
116
-
117
-
118
-
119
-
120
-
121
-
122
-
123
-
124
-
125
-
126
-
127
-
128
-
129
-
130
 |
 |

GENERAL MOTORS COMPANY AND SUBSIDIARIES
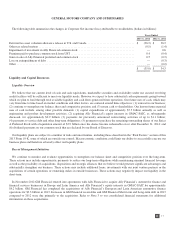
The following data illustrates the sensitivity of changes in pension expense and pension obligation based on the last remeasurement
of the U.S. hourly pension plan at December 31, 2013 (dollars in millions):
Effect on 2014
Pension Expense
Effect on December 31,
2013 PBO
Change in future benefit units
One percentage point increase in benefit units ....................................... +$ 69 +$ 206
One percentage point decrease in benefit units ....................................... ⳮ$66 ⳮ$ 200
Refer to Note 15 to our consolidated financial statements for the expected weighted-average long-term rate of return on plan assets,
weighted-average discount rate on plan obligations and actual and expected return on plan assets. Refer to Note 2 to our consolidated
financial statements for a discussion of the inputs used to determine fair value for each significant asset class or category.
Valuation of Deferred Tax Assets
We evaluate the need for deferred tax asset valuation allowances based on a more likely than not standard. The ability to realize
deferred tax assets depends on the ability to generate sufficient taxable income within the carryback or carryforward periods provided
for in the tax law for each applicable tax jurisdiction. It is difficult to conclude a valuation allowance is not required when there is
significant objective and verifiable negative evidence, such as cumulative losses in recent years. We utilize a rolling three years of
actual and current year anticipated results as the primary measure of cumulative losses in recent years. Our accounting for deferred tax
consequences represents our best estimate of future events. Changes in our current estimates, due to unanticipated events or otherwise,
could have a material effect on our financial condition and results of operations. At December 31, 2013 we retained valuation
allowances of $10.8 billion against deferred tax assets primarily in GME and South Korea business units with losses and in the U.S.
and Canada related primarily to capital loss tax attributes and state operating loss carryforwards.
If law is enacted that reduces the U.S. statutory rate, we would record a significant reduction to the net deferred tax assets and a
related increase to income tax expense in the period that includes the enactment date of the tax rate change.
Impairment of Goodwill
When applying fresh-start reporting, certain accounts, primarily employee benefit and income tax related, were recorded at amounts
determined under specific U.S. GAAP rather than fair value and the difference between the U.S. GAAP and fair value amounts gave
rise to goodwill, which is a residual. If all identifiable assets and liabilities had been recorded at fair value upon application of fresh-
start reporting, no goodwill would have resulted. Goodwill established at fresh-start was $30.5 billion of which $30.4 billion has been
impaired through December 31, 2013.
In the three months ended December 31, 2013 we performed our annual goodwill impairment testing as of October 1 for all
reporting units with Goodwill. Our reporting units are GMNA, GME and various reporting units within the GMIO, GMSA and GM
Financial segments. In the year ended December 31, 2013 we also performed event-driven goodwill impairment tests at various dates
for certain of our reporting units. Based on our testing procedures we recorded Goodwill impairment charges of $0.5 billion in the
year ended December 31, 2013 primarily associated with our GM Korea and GM India reporting units. Subsequent to the recording of
the Goodwill impairment charges in the year ended December 31, 2013 we had Goodwill of $1.6 billion at December 31, 2013 which
resulted primarily from the acquisition of AmeriCredit Corp in 2011.
Refer to Note 10 to our consolidated financial statements for additional information on goodwill impairments.
For purposes of our 2013 annual impairment testing procedures at October 1, 2013 the estimated fair value of GM Financial’s
North American reporting unit exceeded its carrying amount by 29%. Due to anticipated changes in GM Financial’s business model to
continue to introduce higher credit quality products into its lending portfolio, the initial equity retention ratio assumption of 12.5%
was forecasted to decrease to 7.5% by 2018 in the discounted cash flow analysis utilized for goodwill impairment testing purposes.
Having higher credit quality products comprising a larger percentage of GM Financial’s lending portfolio will require less equity. GM
Korea’s fair value continued to be below its carrying amount and GM India’s carrying amount became negative.
45