General Motors 2013 Annual Report Download - page 23
Download and view the complete annual report
Please find page 23 of the 2013 General Motors annual report below. You can navigate through the pages in the report by either clicking on the pages listed below, or by using the keyword search tool below to find specific information within the annual report.-
 1
1 -
2
-
3
-
4
-
5
-
6
-
7
-
8
-
9
-
10
-
11
-
12
-
 13
13 -
 14
14 -
 15
15 -
 16
16 -
 17
17 -
 18
18 -
 19
19 -
 20
20 -
 21
21 -
 22
22 -
 23
23 -
 24
24 -
 25
25 -
 26
26 -
 27
27 -
 28
28 -
 29
29 -
 30
30 -
 31
31 -
 32
32 -
 33
33 -
34
-
35
-
36
-
37
-
38
-
39
-
40
-
41
-
42
-
43
-
44
-
45
-
46
-
47
-
48
-
49
-
50
-
51
-
52
-
53
-
54
-
55
-
56
-
57
-
58
-
59
-
60
-
61
-
62
-
63
-
64
-
65
-
66
-
67
-
68
-
69
-
70
-
71
-
72
-
73
-
74
-
75
-
76
-
77
-
78
-
79
-
80
-
81
-
82
-
83
-
84
-
85
-
86
-
87
-
88
-
89
-
90
-
91
-
92
-
93
-
94
-
95
-
96
-
97
-
98
-
99
-
100
-
101
-
102
-
103
-
104
-
105
-
106
-
107
-
108
-
109
-
110
-
111
-
112
-
113
-
114
-
115
-
116
-
117
-
118
-
119
-
120
-
121
-
122
-
123
-
124
-
125
-
126
-
127
-
128
-
129
-
130
 |
 |

GENERAL MOTORS COMPANY AND SUBSIDIARIES
In the year ended December 31, 2013 Automotive Total net sales and revenue increased due primarily to: (1) favorable vehicle
pricing effect due primarily to GMNA of $1.9 billion; (2) favorable vehicle mix due primarily to GMNA of $1.3 billion and GMSA of
$0.6 billion; partially offset by (3) Other of $1.9 billion due primarily to unfavorable net foreign currency effect of $2.3 billion due
from the weakening of the Brazilian Real, Argentinian Peso and Venezuela Bolivar Fuerte against the U.S. Dollar; partially offset by
increased other revenue of $0.4 billion due primarily to increases in OnStar, LLC and parts and accessories revenue; and (4) decreased
wholesale volumes.
In the year ended December 31, 2013 GM Financial Total sales and revenue increased due primarily to: (1) increased finance
charge income of $1.0 billion due to growth in the portfolio resulting from the acquisition of Ally Financial’s international operations
and increased originations; and (2) increased leased vehicle income of $0.3 billion due to the increased size of the leased asset
portfolio.
In the year ended December 31, 2012 Automotive Total net sales and revenue increased due primarily to: (1) favorable vehicle mix
due primarily to GMSA of $1.6 billion, GMNA of $0.7 billion and GME of $0.4 billion; (2) increased wholesale volumes due
primarily to GMNA of $3.8 billion and GMIO of $1.4 billion; partially offset by decreases in GME of $2.4 billion and GMSA of $0.6
billion; (3) favorable vehicle pricing effect due primarily to GMIO of $0.8 billion, GMNA of $0.5 billion and GMSA of $0.5 billion;
partially offset by (4) Other of $5.3 billion due primarily to unfavorable net foreign currency effect of $3.7 billion due primarily to the
weakening of the Brazilian Real, Euro, Korean Won, Argentinian Peso and South African Zar against the U.S. Dollar; decreased
revenues from powertrain and parts sales of $0.7 billion due to decreased volumes; reduction in favorable lease residual adjustments
of $0.5 billion; decreased revenues from rental car leases of $0.2 billion; and decreased revenues due to the deconsolidation of VM
Motori (VMM) in June 2011 of $0.1 billion.
In the year ended December 31, 2012 GM Financial Total sales and revenue increased due primarily to: (1) increased finance
charge income of $0.3 billion, due to a larger portfolio; and (2) increased leased vehicles income of $0.2 billion due to the increased
size of the leased asset portfolio.
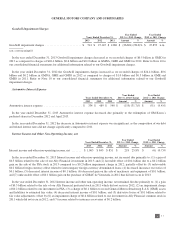
Automotive Cost of Sales
Years Ended December 31,
Year Ended
2013 vs. 2012 Change Variance Due To
2013 2012
Favorable/
(Unfavorable) % Volume Mix Other Total
(Dollars in millions) (Dollars in billions)
Automotive cost of sales ............. $ 134,925 $ 140,236 $ 5,311 3.8% $ 0.3 $ (2.3) $ 7.3 $ 5.3
Automotive gross margin ............ $ 17,167 $ 10,059 $ 7,108 70.7%
Years Ended December 31,
Year Ended
2012 vs. 2011 Change Variance Due To
2012 2011
Favorable/
(Unfavorable) % Volume Mix Other Total
(Dollars in millions) (Dollars in billions)
Automotive cost of sales ............. $ 140,236 $ 130,386 $ (9,850) (7.6)% $ (0.9) $ (3.8) $ (5.2) $ (9.9)
Automotive gross margin ............ $ 10,059 $ 18,480 $ (8,421) (45.6)%
The most significant element of our Automotive cost of sales is material cost which makes up approximately two-thirds of the total
amount excluding adjustments. The remaining portion includes labor costs, depreciation and amortization, engineering, and policy,
product warranty and recall campaigns.
In the year ended December 31, 2013 Automotive cost of sales decreased due primarily to: (1) Other of $7.3 billion due to
decreased impairment charges of $2.8 billion for long-lived assets and intangible assets; decreased pension settlement losses of $2.5
billion; the favorable effect of $1.3 billion resulting from the reversal of the Korea wage litigation accrual in 2013 compared to
accruals related to the litigation in 2012; favorable net foreign currency effect of $0.9 billion due primarily to the weakening of the
Brazilian Real against the U.S. Dollar; and reduction in unfavorable warranty and policy adjustments of $0.7 billion; partially offset
21