General Motors 2013 Annual Report Download - page 24
Download and view the complete annual report
Please find page 24 of the 2013 General Motors annual report below. You can navigate through the pages in the report by either clicking on the pages listed below, or by using the keyword search tool below to find specific information within the annual report.-
 1
1 -
2
-
3
-
4
-
5
-
6
-
7
-
8
-
9
-
10
-
11
-
12
-
13
-
 14
14 -
 15
15 -
 16
16 -
 17
17 -
 18
18 -
 19
19 -
 20
20 -
 21
21 -
 22
22 -
 23
23 -
 24
24 -
 25
25 -
 26
26 -
 27
27 -
 28
28 -
 29
29 -
 30
30 -
 31
31 -
 32
32 -
 33
33 -
 34
34 -
35
-
36
-
37
-
38
-
39
-
40
-
41
-
42
-
43
-
44
-
45
-
46
-
47
-
48
-
49
-
50
-
51
-
52
-
53
-
54
-
55
-
56
-
57
-
58
-
59
-
60
-
61
-
62
-
63
-
64
-
65
-
66
-
67
-
68
-
69
-
70
-
71
-
72
-
73
-
74
-
75
-
76
-
77
-
78
-
79
-
80
-
81
-
82
-
83
-
84
-
85
-
86
-
87
-
88
-
89
-
90
-
91
-
92
-
93
-
94
-
95
-
96
-
97
-
98
-
99
-
100
-
101
-
102
-
103
-
104
-
105
-
106
-
107
-
108
-
109
-
110
-
111
-
112
-
113
-
114
-
115
-
116
-
117
-
118
-
119
-
120
-
121
-
122
-
123
-
124
-
125
-
126
-
127
-
128
-
129
-
130
 |
 |

GENERAL MOTORS COMPANY AND SUBSIDIARIES
by increased material and freight costs of $0.4 billion; increased costs of $0.2 billion related to parts and accessories sales; and net
increased manufacturing expenses of $0.1 billion due primarily to new launch costs offset by reduced depreciation and amortization;
(2) decreased costs related to decreased wholesale volumes; partially offset by (3) unfavorable vehicle mix due primarily to GMNA of
$1.3 billion, GMSA of $0.4 billion and GMIO of $0.4 billion.
In the year ended December 31, 2012 Automotive cost of sales increased due primarily to: (1) Other of $5.2 billion due primarily to
increased employee costs of $4.1 billion including increased pension settlement losses and decreased net pension and other
postretirement benefits (OPEB) income and separation costs; impairment charges of $3.7 billion for long-lived assets and intangible
assets; increased manufacturing expense of $1.4 billion due to new launches; increased policy and product warranty expense of $0.2
billion; partially offset by favorable net foreign currency effect of $3.3 billion due primarily to the weakening of the Brazilian Real,
Euro, Korean Won, Argentinian Peso and South African Zar against the U.S. Dollar; decreased engineering expense of $0.5 billion;
decreased costs of $0.3 billion related to powertrain and parts sales; and decreased costs of $0.1 billion due to the deconsolidation of
VMM in June 2011; (2) unfavorable vehicle mix due primarily to GMNA of $1.3 billion, GMSA of $1.2 billion and GME of $0.8
billion; and (3) increased costs related to increased wholesale volumes due primarily to GMNA of $2.7 billion; partially offset by a
decrease in GME of $1.9 billion.
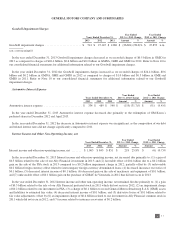
GM Financial Operating and Other Expenses
Years Ended December 31,
Year Ended
2013 vs. 2012 Change
Year Ended
2012 vs. 2011 Change
2013 2012 2011 Amount % Amount %
GM Financial operating and other expenses ................... $ 2,448 $ 1,207 $ 785 $ 1,241 102.8% $ 422 53.8%
In the year ended December 31, 2013 GM Financial operating and other expenses increased primarily due to: (1) an increase in
interest expense of $0.4 billion due to higher average debt outstanding in 2013 compared to 2012, primarily resulting from the
acquisition of Ally Financial’s international operations; (2) an increase in employee and other operating costs of $0.4 billion due
primarily to the acquisition of Ally Financial’s international operations and an increase in headcount; (3) an increase in the provision
for loan losses of $0.2 billion due primarily to growth of the consumer loan portfolio; and (4) an increase in depreciation expense of
$0.2 billion due primarily to the increased size of the leased asset portfolio.
In the year ended December 31, 2012 GM Financial operating and other expenses increased primarily due to: (1) an increase in
depreciation expense of $0.1 billion due to the increased size of the leased asset portfolio; (2) an increase in the provision for loan
losses of $0.1 billion due primarily to growth of the consumer loan portfolio; (3) an increase in interest expense of $0.1 billion due to
higher average debt outstanding in 2012 compared to 2011; and (4) an increase in employee costs of $0.1 billion due primarily to a
9% increase in employee headcount to support growth in GM Financial’s business.
Automotive Selling, General and Administrative Expense
Years Ended December 31,
Year Ended
2013 vs. 2012 Change
Year Ended
2012 vs. 2011 Change
2013 2012 2011 Amount % Amount %
Automotive selling, general and administrative expense ..... $ 12,382 $ 14,031 $ 12,163 $ (1,649) (11.8)% $ 1,868 15.4%
In the year ended December 31, 2013 Automotive selling, general and administrative expense decreased due primarily to: (1)
impairment charges in GME for intangibles and long-lived assets of $1.8 billion that occurred in 2012 but not in 2013; and (2) a
premium paid of $0.4 billion on the common stock purchase from the UST that occurred in 2012 but not in 2013; partially offset by
(3) costs related to our plans to cease mainstream distribution of Chevrolet brand in Europe of $0.5 billion.
In the year ended December 31, 2012 Automotive selling, general and administrative expense increased due primarily to:
(1) impairment charges in GME for intangibles and long-lived assets of $1.8 billion; and (2) a premium paid of $0.4 billion on the
common stock purchase from the UST; partially offset by (3) favorable net foreign currency effect of $0.3 billion due to the
weakening of certain currencies against the U.S. Dollar.
22
2013 ANNUAL REPORT