General Motors 2013 Annual Report Download - page 88
Download and view the complete annual report
Please find page 88 of the 2013 General Motors annual report below. You can navigate through the pages in the report by either clicking on the pages listed below, or by using the keyword search tool below to find specific information within the annual report.-
 1
1 -
2
-
3
-
4
-
5
-
6
-
7
-
8
-
9
-
10
-
11
-
12
-
13
-
14
-
15
-
16
-
17
-
18
-
19
-
20
-
21
-
22
-
23
-
24
-
25
-
26
-
27
-
28
-
29
-
30
-
31
-
32
-
33
-
34
-
35
-
36
-
37
-
38
-
39
-
40
-
41
-
42
-
43
-
44
-
45
-
46
-
47
-
48
-
49
-
50
-
51
-
52
-
53
-
54
-
55
-
56
-
57
-
58
-
59
-
60
-
61
-
62
-
63
-
64
-
65
-
66
-
67
-
68
-
69
-
70
-
71
-
72
-
73
-
74
-
75
-
76
-
77
-
 78
78 -
 79
79 -
 80
80 -
 81
81 -
 82
82 -
 83
83 -
 84
84 -
 85
85 -
 86
86 -
 87
87 -
 88
88 -
 89
89 -
 90
90 -
 91
91 -
 92
92 -
 93
93 -
 94
94 -
 95
95 -
 96
96 -
 97
97 -
 98
98 -
99
-
100
-
101
-
102
-
103
-
104
-
105
-
106
-
107
-
108
-
109
-
110
-
111
-
112
-
113
-
114
-
115
-
116
-
117
-
118
-
119
-
120
-
121
-
122
-
123
-
124
-
125
-
126
-
127
-
128
-
129
-
130
 |
 |

GENERAL MOTORS COMPANY AND SUBSIDIARIES
NOTES TO CONSOLIDATED FINANCIAL STATEMENTS — (Continued)
affect their economic performance. Our variable interests in these nonconsolidated VIEs include accounts and notes receivable, equity in
net assets, guarantees and financial support, some of which were provided to certain current or previously divested suppliers in order to
ensure that supply needs for production were not disrupted due to a supplier’s liquidity concerns or possible shutdowns.
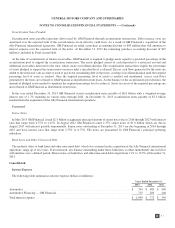
At December 31, 2013 and 2012 our variable interests in these VIEs included: (1) Total assets of $169 million and $351 million,
which were composed of Accounts and notes receivable, net and Equity in net assets of nonconsolidated affiliates; (2) Total liabilities
of $838 million and $1.9 billion, which were composed of Accounts payable (principally trade), Short-term debt and current portion
of long-term debt, Accrued liabilities and Other liabilities and deferred income taxes; and (3) Total off-balance sheet arrangements of
$115 million and $32 million, which were composed of loan commitments and other liquidity arrangements. The amount of total off-
balance sheet arrangements at December 31, 2013 includes contractual commitments under an agreement with a supplier that became
a VIE in January 2013. The maximum exposure to loss for total assets approximated the carrying amount at December 31, 2013 and
2012. Refer to Note 17 for additional information on our maximum exposure to loss under agreements with Ally Financial.
Ally Financial Common Stock
At December 31, 2012 we held a 9.9% common equity ownership in Ally Financial with carrying amount and fair value of $399
million and $1.3 billion. We estimated the fair value of Ally Financial common stock using a market approach that applied the
average price to tangible book value multiples of comparable companies to the consolidated Ally Financial tangible book value. The
significant inputs used in our fair value analyses included Ally Financial’s financial statements, financial statements and price to
tangible book value multiples of comparable companies in the banking and finance industry and the effects of certain Ally Financial
shareholder rights. The inputs used in the measurement of the fair value are Level 3 inputs. In December 2013 we sold our investment
through a private offering for net proceeds of $880 million and recorded a gain of $483 million in Interest income and other non-
operating income, net.
Ally Financial Preferred Stock
In March 2011 our investment in Ally Financial preferred stock was sold through a public offering for net proceeds of $1.0 billion.
The gain of $339 million related to the sale was recorded in Interest income and other non-operating income, net.
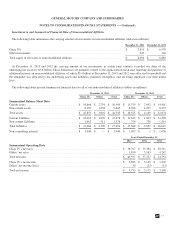
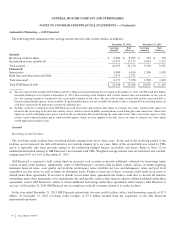
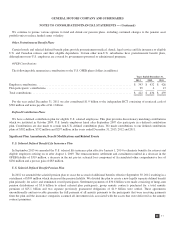
Note 13. Accrued Liabilities, Other Liabilities and Deferred Income Taxes
The following table summarizes the components of Accrued liabilities and Other liabilities and deferred income taxes (dollars in
millions):
December 31, 2013 December 31, 2012
Current
Dealer and customer allowances, claims and discounts .................................. $ 7,919 $ 7,722
Deposits primarily from rental car companies ......................................... 4,713 4,250
Deferred revenue ................................................................ 1,276 1,326
Policy, product warranty and recall campaigns ........................................ 2,559 2,919
Payrolls and employee benefits excluding postemployment benefits ....................... 2,285 2,144
Other ......................................................................... 5,881 4,947
Total accrued liabilities ........................................................... $ 24,633 $ 23,308
Non-current
Deferred revenue ................................................................ $ 1,249 $ 1,169
Policy, product warranty and recall campaigns ........................................ 4,655 4,285
Employee benefits excluding postemployment benefits .................................. 1,192 1,359
Postemployment benefits including facility idling reserves ............................... 1,216 1,518
Other ......................................................................... 5,041 4,838
Total other liabilities and deferred income taxes ....................................... $ 13,353 $ 13,169
86
2013 ANNUAL REPORT