General Motors 2013 Annual Report Download - page 40
Download and view the complete annual report
Please find page 40 of the 2013 General Motors annual report below. You can navigate through the pages in the report by either clicking on the pages listed below, or by using the keyword search tool below to find specific information within the annual report.-
 1
1 -
2
-
3
-
4
-
5
-
6
-
7
-
8
-
9
-
10
-
11
-
12
-
13
-
14
-
15
-
16
-
17
-
18
-
19
-
20
-
21
-
22
-
23
-
24
-
25
-
26
-
27
-
28
-
29
-
 30
30 -
 31
31 -
 32
32 -
 33
33 -
 34
34 -
 35
35 -
 36
36 -
 37
37 -
 38
38 -
 39
39 -
 40
40 -
 41
41 -
 42
42 -
 43
43 -
 44
44 -
 45
45 -
 46
46 -
 47
47 -
 48
48 -
 49
49 -
 50
50 -
51
-
52
-
53
-
54
-
55
-
56
-
57
-
58
-
59
-
60
-
61
-
62
-
63
-
64
-
65
-
66
-
67
-
68
-
69
-
70
-
71
-
72
-
73
-
74
-
75
-
76
-
77
-
78
-
79
-
80
-
81
-
82
-
83
-
84
-
85
-
86
-
87
-
88
-
89
-
90
-
91
-
92
-
93
-
94
-
95
-
96
-
97
-
98
-
99
-
100
-
101
-
102
-
103
-
104
-
105
-
106
-
107
-
108
-
109
-
110
-
111
-
112
-
113
-
114
-
115
-
116
-
117
-
118
-
119
-
120
-
121
-
122
-
123
-
124
-
125
-
126
-
127
-
128
-
129
-
130
 |
 |

GENERAL MOTORS COMPANY AND SUBSIDIARIES
was due primarily to favorable movements in dealer and customer allowances of $0.9 billion, other deferred tax provisions of $0.9
billion and policy and warranty of $0.6 billion. In the year ended December 31, 2011 Other was due primarily to gains on the sale of
our investments in New Delphi Class A Membership Interests and Ally Financial preferred stock of $2.0 billion, unfavorable
movements in accrued and other liabilities of $0.7 billion and equipment on operating leases of $0.5 billion.
Years Ended December 31,
2013 2012 2011
Investing Activities
Capital expenditures ................................................................. $ (7.5) $ (8.1) $ (6.2)
Liquidations (acquisitions) of marketable securities, net ..................................... 0.1 6.9 (10.6)
Sale of our investment in Ally Financial .................................................. 0.9 — 1.0
Sale of our investment in Delphi ........................................................ — — 3.8
Other ............................................................................. 0.4 0.5 1.4
Cash flows from investing activities ..................................................... $ (6.1) $ (0.7) $ (10.6)
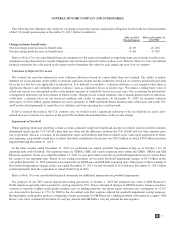
Changes in the (Acquisitions) liquidations of marketable securities, net were due to varying maturities of investments as we
rebalanced our investment portfolio in the normal course of business. Other was due primarily to the release of restricted cash,
including the release of $1.0 billion associated with the implementation of the HCT in the year ended December 31, 2011.
Years Ended December 31,
2013 2012 2011
Financing Activities
Issuance of senior unsecured notes ....................................................... $ 4.5 $ — $ —
Prepayment of HCT notes .............................................................. (1.1) — —
Early redemption of GM Korea preferred stock ............................................. (0.7) (0.7) —
Purchase of Series A Preferred Stock ..................................................... (3.2) — —
Purchase of Common Stock (excluding charge related to purchase premium) ...................... — (5.1) —
Dividends paid (excluding charge related to purchase of series A Preferred Stock) ................. (0.9) (0.9) (0.9)
Other .............................................................................. — (0.4) (1.0)
Cash flows from financing activities ...................................................... $ (1.4) $ (7.1) $ (1.9)
Other was due primarily to prepayments on debt facilities held by certain of our foreign subsidiaries, primarily in GMNA and
GMSA, of $1.0 billion in the year ended December 31, 2011.
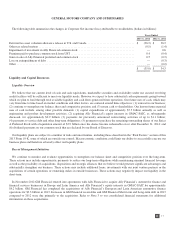
Free Cash Flow and Adjusted Free Cash Flow
The following table summarizes free cash flow and adjusted free cash flow (dollars in millions):
Years Ended December 31,
2013 2012 2011
Operating cash flow .............................................................. $ 11,021 $ 9,631 $ 7,429
Less: capital expenditures ......................................................... (7,549) (8,055) (6,241)
Free cash flow .................................................................. 3,472 1,576 1,188
Adjustments .................................................................... 225 2,712 1,830
Adjusted free cash flow ........................................................... $ 3,697 $ 4,288 $ 3,018
Adjustments to free cash flow included the following items: accrued interest on the prepayment of the HCT notes of $0.2 billion in
October 2013 and pension contributions of $0.1 billion related to the previously announced annuitization of the U.S. salaried pension
38
2013 ANNUAL REPORT