General Motors 2013 Annual Report Download - page 112
Download and view the complete annual report
Please find page 112 of the 2013 General Motors annual report below. You can navigate through the pages in the report by either clicking on the pages listed below, or by using the keyword search tool below to find specific information within the annual report.-
 1
1 -
2
-
3
-
4
-
5
-
6
-
7
-
8
-
9
-
10
-
11
-
12
-
13
-
14
-
15
-
16
-
17
-
18
-
19
-
20
-
21
-
22
-
23
-
24
-
25
-
26
-
27
-
28
-
29
-
30
-
31
-
32
-
33
-
34
-
35
-
36
-
37
-
38
-
39
-
40
-
41
-
42
-
43
-
44
-
45
-
46
-
47
-
48
-
49
-
50
-
51
-
52
-
53
-
54
-
55
-
56
-
57
-
58
-
59
-
60
-
61
-
62
-
63
-
64
-
65
-
66
-
67
-
68
-
69
-
70
-
71
-
72
-
73
-
74
-
75
-
76
-
77
-
78
-
79
-
80
-
81
-
82
-
83
-
84
-
85
-
86
-
87
-
88
-
89
-
90
-
91
-
92
-
93
-
94
-
95
-
96
-
97
-
98
-
99
-
100
-
101
-
 102
102 -
 103
103 -
 104
104 -
 105
105 -
 106
106 -
 107
107 -
 108
108 -
 109
109 -
 110
110 -
 111
111 -
 112
112 -
 113
113 -
 114
114 -
 115
115 -
 116
116 -
 117
117 -
 118
118 -
 119
119 -
 120
120 -
 121
121 -
 122
122 -
123
-
124
-
125
-
126
-
127
-
128
-
129
-
130
 |
 |

GENERAL MOTORS COMPANY AND SUBSIDIARIES
NOTES TO CONSOLIDATED FINANCIAL STATEMENTS — (Continued)
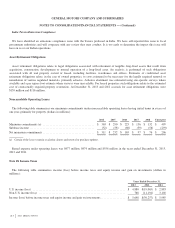
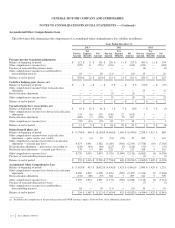
Deferred Income Tax Assets and Liabilities
Deferred income tax assets and liabilities at December 31, 2013 and 2012 reflect the effect of temporary differences between
amounts of assets, liabilities and equity for financial reporting purposes and the bases of such assets, liabilities and equity as measured
by tax laws, as well as tax loss and tax credit carryforwards. The following table summarizes the components of temporary differences
and carryforwards that give rise to deferred tax assets and liabilities (dollars in millions):
December 31, 2013 December 31, 2012
Deferred tax assets
Postretirement benefits other than pensions ........................................... $ 2,902 $ 3,494
Pension and other employee benefit plans ............................................ 5,469 8,536
Warranties, dealer and customer allowances, claims and discounts ......................... 4,282 4,277
Property, plants and equipment ..................................................... 2,464 2,225
Capitalized research expenditures ................................................... 7,179 6,106
Operating loss and tax credit carryforwards (a) ........................................ 19,342 20,220
Miscellaneous .................................................................. 1,663 3,443
Total deferred tax assets before valuation allowances ................................. 43,301 48,301
Less: valuation allowances ........................................................ (10,823) (10,991)
Total deferred tax assets .......................................................... 32,478 37,310
Deferred tax liabilities
Intangible assets ................................................................ 397 724
Net deferred tax assets ........................................................... $ 32,081 $ 36,586
(a) Includes operating loss and tax credit carryforwards of $16.3 billion expiring through 2033 and $3.0 billion that may be carried forward
indefinitely at December 31, 2013.
At December 31, 2013 we retained valuation allowances of $10.8 billion against deferred tax assets primarily in GME and South
Korea business units with losses and in the U.S. and Canada related primarily to capital loss tax attributes and state operating loss
carryforwards.
At December 31, 2012 as a result of sustained profitability in the U.S. and Canada evidenced by three years of earnings and the
completion of our near- and medium-term business plans in the three months ended December 31, 2012 that forecast continuing
profitability, we determined it was more likely than not future earnings will be sufficient to realize deferred tax assets in these two
jurisdictions. Accordingly we reversed most of the U.S. and Canadian valuation allowances resulting in non-cash income tax benefits
of $33.2 billion and $3.1 billion.
At December 31, 2011 as a result of sustained profitability in Australia, we released the valuation allowance against deferred tax
assets. The reduction in the valuation allowance resulted in a non-cash income tax benefit of $502 million. In Australia we have net
operating loss carryforwards which are subject to meeting a “Same Business Test” requirement that we assess on a quarterly basis. At
December 31, 2013 as a result of our plans to cease vehicle and engine manufacturing at Holden, we determined that it was more
likely than not Holden would not realize a portion of the deferred tax assets and recorded a valuation allowance in the amount of $133
million.
110
2013 ANNUAL REPORT