General Motors 2013 Annual Report Download - page 80
Download and view the complete annual report
Please find page 80 of the 2013 General Motors annual report below. You can navigate through the pages in the report by either clicking on the pages listed below, or by using the keyword search tool below to find specific information within the annual report.-
 1
1 -
2
-
3
-
4
-
5
-
6
-
7
-
8
-
9
-
10
-
11
-
12
-
13
-
14
-
15
-
16
-
17
-
18
-
19
-
20
-
21
-
22
-
23
-
24
-
25
-
26
-
27
-
28
-
29
-
30
-
31
-
32
-
33
-
34
-
35
-
36
-
37
-
38
-
39
-
40
-
41
-
42
-
43
-
44
-
45
-
46
-
47
-
48
-
49
-
50
-
51
-
52
-
53
-
54
-
55
-
56
-
57
-
58
-
59
-
60
-
61
-
62
-
63
-
64
-
65
-
66
-
67
-
68
-
69
-
 70
70 -
 71
71 -
 72
72 -
 73
73 -
 74
74 -
 75
75 -
 76
76 -
 77
77 -
 78
78 -
 79
79 -
 80
80 -
 81
81 -
 82
82 -
 83
83 -
 84
84 -
 85
85 -
 86
86 -
 87
87 -
 88
88 -
 89
89 -
 90
90 -
91
-
92
-
93
-
94
-
95
-
96
-
97
-
98
-
99
-
100
-
101
-
102
-
103
-
104
-
105
-
106
-
107
-
108
-
109
-
110
-
111
-
112
-
113
-
114
-
115
-
116
-
117
-
118
-
119
-
120
-
121
-
122
-
123
-
124
-
125
-
126
-
127
-
128
-
129
-
130
 |
 |

GENERAL MOTORS COMPANY AND SUBSIDIARIES
NOTES TO CONSOLIDATED FINANCIAL STATEMENTS — (Continued)
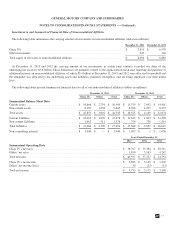
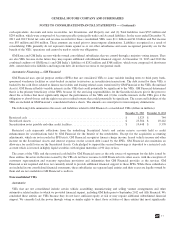
Transactions with Nonconsolidated Affiliates
Nonconsolidated affiliates are involved in various aspects of the development, production and marketing of cars, trucks and
automobile parts. We purchase component parts and vehicles from certain nonconsolidated affiliates for resale to dealers. We also sell
component parts and vehicles to certain nonconsolidated affiliates. The following tables summarize the effects of transactions with
nonconsolidated affiliates (dollars in millions):
Years Ended December 31,
2013 2012 2011
Results of Operations
Automotive sales and revenue ....................................................... $ 2,724 $ 2,572 $ 3,266
Automotive purchases, net .......................................................... $ 724 $ 497 $ 1,044
Interest income and other non-operating income, net ..................................... $ 19 $ 184 $ 34
December 31, 2013 December 31, 2012
Financial Position
Accounts and notes receivable, net .................................................. $ 756 $ 1,668
Accounts payable ............................................................... $ 183 $ 167
Deferred revenue and customer deposits ............................................. $ 32 $ 46
Years Ended December 31,
2013 2012 2011
Cash Flows
Operating ....................................................................... $ 3,607 $ 3,385 $ 3,624
Investing ........................................................................ $ (13) $ (41) $ (27)
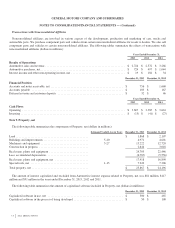
Note 9. Property, net
The following table summarizes the components of Property, net (dollars in millions):
Estimated Useful Lives in Years December 31, 2013 December 31, 2012
Land .................................................. $ 1,868 $ 2,107
Buildings and improvements ............................... 5-40 4,971 4,601
Machinery and equipment ................................. 3-27 15,222 12,720
Construction in progress .................................. 2,644 3,018
Real estate, plants and equipment ........................... 24,705 22,446
Less: accumulated depreciation ............................. (6,787) (5,556)
Real estate, plants and equipment, net ....................... 17,918 16,890
Special tools, net ........................................ 1-15 7,949 7,306
Total property, net ....................................... $ 25,867 $ 24,196
The amount of interest capitalized and excluded from Automotive interest expense related to Property, net was $81 million, $117
million and $91 million in the years ended December 31, 2013, 2012 and 2011.
The following table summarizes the amount of capitalized software included in Property, net (dollars in millions):
December 31, 2013 December 31, 2012
Capitalized software in use, net .................................................... $ 580 $ 465
Capitalized software in the process of being developed .................................. $ 50 $ 108
78
2013 ANNUAL REPORT