General Motors 2013 Annual Report Download - page 28
Download and view the complete annual report
Please find page 28 of the 2013 General Motors annual report below. You can navigate through the pages in the report by either clicking on the pages listed below, or by using the keyword search tool below to find specific information within the annual report.-
 1
1 -
2
-
3
-
4
-
5
-
6
-
7
-
8
-
9
-
10
-
11
-
12
-
13
-
14
-
15
-
16
-
17
-
 18
18 -
 19
19 -
 20
20 -
 21
21 -
 22
22 -
 23
23 -
 24
24 -
 25
25 -
 26
26 -
 27
27 -
 28
28 -
 29
29 -
 30
30 -
 31
31 -
 32
32 -
 33
33 -
 34
34 -
 35
35 -
 36
36 -
 37
37 -
 38
38 -
39
-
40
-
41
-
42
-
43
-
44
-
45
-
46
-
47
-
48
-
49
-
50
-
51
-
52
-
53
-
54
-
55
-
56
-
57
-
58
-
59
-
60
-
61
-
62
-
63
-
64
-
65
-
66
-
67
-
68
-
69
-
70
-
71
-
72
-
73
-
74
-
75
-
76
-
77
-
78
-
79
-
80
-
81
-
82
-
83
-
84
-
85
-
86
-
87
-
88
-
89
-
90
-
91
-
92
-
93
-
94
-
95
-
96
-
97
-
98
-
99
-
100
-
101
-
102
-
103
-
104
-
105
-
106
-
107
-
108
-
109
-
110
-
111
-
112
-
113
-
114
-
115
-
116
-
117
-
118
-
119
-
120
-
121
-
122
-
123
-
124
-
125
-
126
-
127
-
128
-
129
-
130
 |
 |

GENERAL MOTORS COMPANY AND SUBSIDIARIES
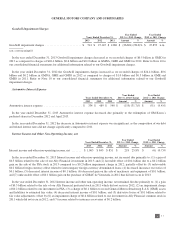
The following tables summarize the reconciliation of our automotive segments EBIT-adjusted and GM Financial’s income before
income taxes to Net income attributable to stockholders and provides supplemental detail of the adjustments, which are presented net
of noncontrolling interests (dollars in millions):
Years Ended December 31,
2013 2012 2011
Automotive
EBIT-adjusted
GMNA ..................................... $ 7,461 97.1% $ 6,470 90.9% $ 6,779 88.2%
GME ...................................... (844) (11.0)% (1,939) (27.2)% (1,041) (13.6)%
GMIO ..................................... 1,230 16.0% 2,528 35.5% 2,232 29.1%
GMSA ..................................... 327 4.3% 457 6.4% 158 2.1%
Corporate and eliminations ..................... (494) (6.4)% (400) (5.6)% (446) (5.8)%
Total automotive EBIT-adjusted ................... 7,680 100.0% 7,116 100.0% 7,682 100.0%
Adjustments ................................ (790) (36,106) 861
Corporate interest income ...................... 249 343 455
Automotive interest expense .................... 338 489 540
Loss on extinguishment of debt ................. 212 250 —
Automotive Financing
GM Financial income before income taxes ........ 898 744 622
Adjustments ................................ (15) — —
Consolidated
Eliminations .................................. 1 (1) —
Income tax expense (benefit) ..................... 2,127 (34,831) (110)
Net income attributable to stockholders ........... $ 5,346 $ 6,188 $ 9,190
Our automotive operations interest and income taxes are recorded centrally in Corporate; therefore, there are no reconciling items
for our automotive operating segments between EBIT-adjusted and Net income attributable to stockholders.
Year Ended December 31, 2013
GMNA GME GMIO GMSA Corporate Total
Impairment charges of property and intangible assets ................ $ —$—$ (774) $ — $ — $ (774)
Costs related to our plans to cease mainstream distribution of Chevrolet
brand in Europe ............................................ — — (621) — — (621)
Reversal of GM Korea wage litigation accrual ...................... — — 577 — — 577
Gain on sale of equity investment in Ally Financial .................. — — — — 483 483
Goodwill impairment charges ................................... — — (442) — — (442)
Venezuela currency devaluation ................................. — — — (162) — (162)
Gain on sale of equity investment in PSA .......................... — 152 — — — 152
Noncontrolling interests related to redemption of the GM Korea
mandatorily redeemable preferred shares ........................ — — 67 — — 67
Pension settlement charges ..................................... (56) — — — — (56)
Charges related to PSA product development agreement .............. (49) — — — — (49)
Income related to insurance recoveries ............................ 5 1 24 5 — 35
Total adjustments to automotive EBIT ............................ $ (100) $ 153 $ (1,169) $ (157) $ 483 $ (790)
26
2013 ANNUAL REPORT