General Motors 2013 Annual Report Download - page 77
Download and view the complete annual report
Please find page 77 of the 2013 General Motors annual report below. You can navigate through the pages in the report by either clicking on the pages listed below, or by using the keyword search tool below to find specific information within the annual report.-
 1
1 -
2
-
3
-
4
-
5
-
6
-
7
-
8
-
9
-
10
-
11
-
12
-
13
-
14
-
15
-
16
-
17
-
18
-
19
-
20
-
21
-
22
-
23
-
24
-
25
-
26
-
27
-
28
-
29
-
30
-
31
-
32
-
33
-
34
-
35
-
36
-
37
-
38
-
39
-
40
-
41
-
42
-
43
-
44
-
45
-
46
-
47
-
48
-
49
-
50
-
51
-
52
-
53
-
54
-
55
-
56
-
57
-
58
-
59
-
60
-
61
-
62
-
63
-
64
-
65
-
66
-
 67
67 -
 68
68 -
 69
69 -
 70
70 -
 71
71 -
 72
72 -
 73
73 -
 74
74 -
 75
75 -
 76
76 -
 77
77 -
 78
78 -
 79
79 -
 80
80 -
 81
81 -
 82
82 -
 83
83 -
 84
84 -
 85
85 -
 86
86 -
 87
87 -
88
-
89
-
90
-
91
-
92
-
93
-
94
-
95
-
96
-
97
-
98
-
99
-
100
-
101
-
102
-
103
-
104
-
105
-
106
-
107
-
108
-
109
-
110
-
111
-
112
-
113
-
114
-
115
-
116
-
117
-
118
-
119
-
120
-
121
-
122
-
123
-
124
-
125
-
126
-
127
-
128
-
129
-
130
 |
 |

GENERAL MOTORS COMPANY AND SUBSIDIARIES
NOTES TO CONSOLIDATED FINANCIAL STATEMENTS — (Continued)
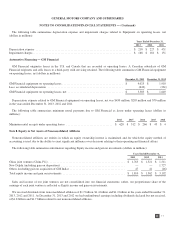
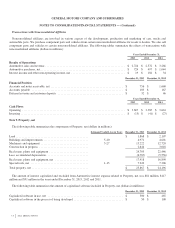
The following table summarizes depreciation expense and impairment charges related to Equipment on operating leases, net
(dollars in millions):
Years Ended December 31,
2013 2012 2011
Depreciation expense .................................................................. $ 218 $ 227 $ 431
Impairment charges .................................................................... $ 168 $ 181 $ 151
Automotive Financing — GM Financial
GM Financial originates leases in the U.S. and Canada that are recorded as operating leases. A Canadian subsidiary of GM
Financial originates and sells leases to a third-party with servicing retained. The following table summarizes GM Financial equipment
on operating leases, net (dollars in millions):
December 31, 2013 December 31, 2012
GM Financial equipment on operating leases .......................................... $ 4,025 $ 1,910
Less: accumulated depreciation .................................................... (642) (261)
GM Financial equipment on operating leases, net ...................................... $ 3,383 $ 1,649
Depreciation expense related to GM Financial equipment on operating leases, net was $450 million, $205 million and $70 million
in the years ended December 31, 2013, 2012 and 2011.
The following table summarizes minimum rental payments due to GM Financial as lessor under operating leases (dollars in
millions):
2014 2015 2016 2017 2018
Minimum rental receipts under operating leases ................................ $ 628 $ 512 $ 266 $ 43 $ 4
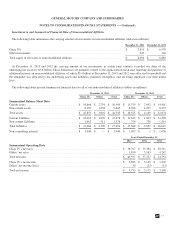
Note 8. Equity in Net Assets of Nonconsolidated Affiliates
Nonconsolidated affiliates are entities in which an equity ownership interest is maintained and for which the equity method of
accounting is used, due to the ability to exert significant influence over decisions relating to their operating and financial affairs.
The following table summarizes information regarding Equity income and gain on investments (dollars in millions):
Years Ended December 31,
2013 2012 2011
China joint ventures (China JVs) ..................................................... $ 1,763 $ 1,521 $ 1,511
New Delphi (including gain on disposition) ............................................ — — 1,727
Others (including gain on acquisition of GM India) ...................................... 47 41 (46)
Total equity income and gain on investments ........................................... $ 1,810 $ 1,562 $ 3,192
Sales and income of our joint ventures are not consolidated into our financial statements; rather, our proportionate share of the
earnings of each joint venture is reflected as Equity income and gain on investments.
We received dividends from nonconsolidated affiliates of $1.7 billion, $1.4 billion and $1.2 billion in the years ended December 31,
2013, 2012 and 2011. At December 31, 2013 and 2012 we had undistributed earnings including dividends declared but not received,
of $1.8 billion and $1.7 billion related to our nonconsolidated affiliates.
75