General Motors 2013 Annual Report Download - page 72
Download and view the complete annual report
Please find page 72 of the 2013 General Motors annual report below. You can navigate through the pages in the report by either clicking on the pages listed below, or by using the keyword search tool below to find specific information within the annual report.-
 1
1 -
2
-
3
-
4
-
5
-
6
-
7
-
8
-
9
-
10
-
11
-
12
-
13
-
14
-
15
-
16
-
17
-
18
-
19
-
20
-
21
-
22
-
23
-
24
-
25
-
26
-
27
-
28
-
29
-
30
-
31
-
32
-
33
-
34
-
35
-
36
-
37
-
38
-
39
-
40
-
41
-
42
-
43
-
44
-
45
-
46
-
47
-
48
-
49
-
50
-
51
-
52
-
53
-
54
-
55
-
56
-
57
-
58
-
59
-
60
-
61
-
 62
62 -
 63
63 -
 64
64 -
 65
65 -
 66
66 -
 67
67 -
 68
68 -
 69
69 -
 70
70 -
 71
71 -
 72
72 -
 73
73 -
 74
74 -
 75
75 -
 76
76 -
 77
77 -
 78
78 -
 79
79 -
 80
80 -
 81
81 -
 82
82 -
83
-
84
-
85
-
86
-
87
-
88
-
89
-
90
-
91
-
92
-
93
-
94
-
95
-
96
-
97
-
98
-
99
-
100
-
101
-
102
-
103
-
104
-
105
-
106
-
107
-
108
-
109
-
110
-
111
-
112
-
113
-
114
-
115
-
116
-
117
-
118
-
119
-
120
-
121
-
122
-
123
-
124
-
125
-
126
-
127
-
128
-
129
-
130
 |
 |

GENERAL MOTORS COMPANY AND SUBSIDIARIES
NOTES TO CONSOLIDATED FINANCIAL STATEMENTS — (Continued)
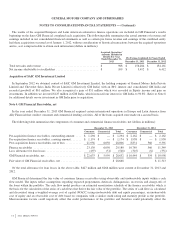
The results of the acquired European and Latin American automotive finance operations are included in GM Financial’s results
beginning on the dates GM Financial completed each acquisition. The following table summarizes the actual amounts of revenue and
earnings included in our consolidated financial statements as well as certain pro forma revenue and earnings of the combined entity
had these acquisitions occurred as of January 1, 2012, without consideration of historical transactions between the acquired operations
and us, as it is impracticable to obtain such information (dollars in millions):
Acquired Operations’
Amounts Included in
Results For Year
Ended December 31,
2013
Pro Forma-Combined for Years Ended
December 31, 2013 December 31, 2012
Total net sales and revenue ....................................... $ 968 $ 156,284 $ 154,161
Net income attributable to stockholders ............................. $ 109 $ 5,492 $ 6,412
Acquisition of SAIC GM Investment Limited
In September 2012 we obtained control of SAIC GM Investment Limited, the holding company of General Motors India Private
Limited and Chevrolet Sales India Private Limited (collectively GM India) with an 86% interest and consolidated GM India and
recorded goodwill of $61 million. We also recognized a gain of $51 million which was recorded in Equity income and gain on
investments. In addition we invested $125 million in GM India, which increased our interest in GM India to 90.8%. Refer to Note 8
for additional details on our investment in GM India prior to acquisition.
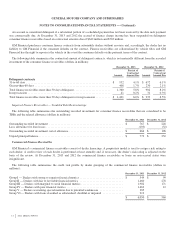
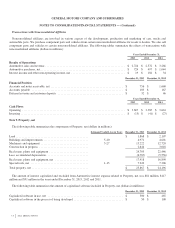
Note 4. GM Financial Receivables, net
In the year ended December 31, 2013 GM Financial acquired certain international operations in Europe and Latin America from
Ally Financial that conduct consumer and commercial lending activities. All of the loans acquired were made on a secured basis.
The following table summarizes the components of consumer and commercial finance receivables, net (dollars in millions):
December 31, 2013 December 31, 2012
Consumer Commercial Total Consumer Commercial Total
Pre-acquisition finance receivables, outstanding amount . . . . $ 1,294 $ — $ 1,294 $ 2,162 $ — $ 2,162
Pre-acquisition finance receivables, carrying amount ....... $ 1,174 $ — $ 1,174 $ 1,958 $ — $ 1,958
Post-acquisition finance receivables, net of fees ........... 21,956 6,050 28,006 8,831 560 9,391
Finance receivables ................................. 23,130 6,050 29,180 10,789 560 11,349
Less: allowance for loan losses ........................ (497) (51) (548) (345) (6) (351)
GM Financial receivables, net ......................... $ 22,633 $ 5,999 $ 28,632 $ 10,444 $ 554 $ 10,998
Fair value of GM Financial receivables, net .............. $ 28,668 $ 11,313
Of the total allowance for loan losses in the above table, $427 million and $266 million were current at December 31, 2013 and
2012.
GM Financial determined the fair value of consumer finance receivables using observable and unobservable inputs within a cash
flow model. The inputs reflect assumptions regarding expected prepayments, deferrals, delinquencies, recoveries and charge-offs of
the loans within the portfolio. The cash flow model produces an estimated amortization schedule of the finance receivables which is
the basis for the calculation of the series of cash flows that derive the fair value of the portfolio. The series of cash flows is calculated
and discounted using a weighted-average cost of capital (WACC) using unobservable debt and equity percentages, an unobservable
cost of equity and an observable cost of debt based on companies with a similar credit rating and maturity profile as the portfolio.
Macroeconomic factors could negatively affect the credit performance of the portfolio and therefore could potentially affect the
70
2013 ANNUAL REPORT