General Motors 2013 Annual Report Download - page 116
Download and view the complete annual report
Please find page 116 of the 2013 General Motors annual report below. You can navigate through the pages in the report by either clicking on the pages listed below, or by using the keyword search tool below to find specific information within the annual report.-
 1
1 -
2
-
3
-
4
-
5
-
6
-
7
-
8
-
9
-
10
-
11
-
12
-
13
-
14
-
15
-
16
-
17
-
18
-
19
-
20
-
21
-
22
-
23
-
24
-
25
-
26
-
27
-
28
-
29
-
30
-
31
-
32
-
33
-
34
-
35
-
36
-
37
-
38
-
39
-
40
-
41
-
42
-
43
-
44
-
45
-
46
-
47
-
48
-
49
-
50
-
51
-
52
-
53
-
54
-
55
-
56
-
57
-
58
-
59
-
60
-
61
-
62
-
63
-
64
-
65
-
66
-
67
-
68
-
69
-
70
-
71
-
72
-
73
-
74
-
75
-
76
-
77
-
78
-
79
-
80
-
81
-
82
-
83
-
84
-
85
-
86
-
87
-
88
-
89
-
90
-
91
-
92
-
93
-
94
-
95
-
96
-
97
-
98
-
99
-
100
-
101
-
102
-
103
-
104
-
105
-
 106
106 -
 107
107 -
 108
108 -
 109
109 -
 110
110 -
 111
111 -
 112
112 -
 113
113 -
 114
114 -
 115
115 -
 116
116 -
 117
117 -
 118
118 -
 119
119 -
 120
120 -
 121
121 -
 122
122 -
 123
123 -
 124
124 -
 125
125 -
 126
126 -
127
-
128
-
129
-
130
 |
 |

GENERAL MOTORS COMPANY AND SUBSIDIARIES
NOTES TO CONSOLIDATED FINANCIAL STATEMENTS — (Continued)
global design studio. This decision affects 2,900 employees from the Elizabeth vehicle manufacturing plant and Holden’s Victorian
workforce. In the three months ended December 31, 2013 we recorded pre-tax charges of $536 million in Automotive cost of sales
consisting primarily of asset impairment charges of $477 million, including property, plant and equipment, which are not included in
the table above. The remaining charges relate to exit-related costs, including certain employee severance related costs, of $59 million
which are included in the table above. We expect to incur additional charges through 2017 for incremental future cash payments of
employee severance once negotiations of the amount are completed. Refer to Note 9 for additional information on the property, plant
and equipment impairment charges.
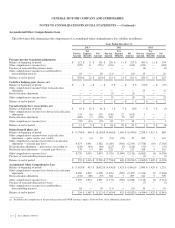
Note 20. Interest Income and Other Non-Operating Income, net
The following table summarizes the components of Interest income and other non-operating income, net (dollars in millions):
Years Ended December 31,
2013 2012 2011
Interest income ...................................................................... $ 246 $ 343 $ 455
Net gains (losses) on derivatives ........................................................ (13) (63) 41
Dividends and royalties ............................................................... 97 98 153
Foreign currency transaction and translation gains (losses) .................................... (154) 16 (48)
Gains (losses) on securities and other investments — realized and unrealized ..................... 691 (193) (9)
Deferred income from technology agreements ............................................. 100 114 113
Other .............................................................................. 96 530 146
Total interest income and other non-operating income, net .................................... $ 1,063 $ 845 $ 851
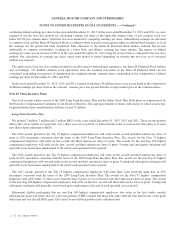
Note 21. Stockholders’ Equity and Noncontrolling Interests
Preferred and Common Stock
We have 2.0 billion shares of preferred stock and 5.0 billion shares of common stock authorized for issuance. We had 156 million
and 276 million shares of Series A Preferred Stock issued and outstanding at December 31, 2013 and 2012. There were no shares of
Series B Preferred Stock issued and outstanding at December 31, 2013 and 100 million shares issued and outstanding at December 31,
2012. We had 1.5 billion and 1.4 billion shares of common stock issued and outstanding at December 31, 2013 and 2012.
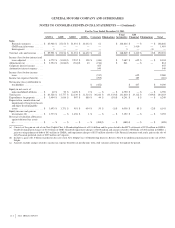
Preferred Stock
The following table summarizes significant features relating to our preferred stock (dollars in millions, except for per share
amounts):
Liquidation
Preference
Per Share
Dividend
Rate
Per Annum
Dividends Paid
Years Ended December 31,
2013 2012 2011
Series A Preferred Stock .......................................... $ 25.00 9.00% $ 1,370 $ 621 $ 621
Series B Preferred Stock .......................................... $ 50.00 4.75% $ 237 $ 238 $ 243
Series A Preferred Stock
The Series A Preferred Stock ranks senior with respect to liquidation preference and dividend rights to our common stock and
Series B Preferred Stock and any other class or series of stock that we may issue. In the event of any voluntary or involuntary
liquidation, dissolution or winding-up of our affairs, a holder of Series A Preferred Stock will be entitled to be paid, before any
distribution or payment may be made to any holders of common stock or other series of stock, the liquidation amount and the amount
114
2013 ANNUAL REPORT