General Motors 2013 Annual Report Download - page 26
Download and view the complete annual report
Please find page 26 of the 2013 General Motors annual report below. You can navigate through the pages in the report by either clicking on the pages listed below, or by using the keyword search tool below to find specific information within the annual report.-
 1
1 -
2
-
3
-
4
-
5
-
6
-
7
-
8
-
9
-
10
-
11
-
12
-
13
-
14
-
15
-
 16
16 -
 17
17 -
 18
18 -
 19
19 -
 20
20 -
 21
21 -
 22
22 -
 23
23 -
 24
24 -
 25
25 -
 26
26 -
 27
27 -
 28
28 -
 29
29 -
 30
30 -
 31
31 -
 32
32 -
 33
33 -
 34
34 -
 35
35 -
 36
36 -
37
-
38
-
39
-
40
-
41
-
42
-
43
-
44
-
45
-
46
-
47
-
48
-
49
-
50
-
51
-
52
-
53
-
54
-
55
-
56
-
57
-
58
-
59
-
60
-
61
-
62
-
63
-
64
-
65
-
66
-
67
-
68
-
69
-
70
-
71
-
72
-
73
-
74
-
75
-
76
-
77
-
78
-
79
-
80
-
81
-
82
-
83
-
84
-
85
-
86
-
87
-
88
-
89
-
90
-
91
-
92
-
93
-
94
-
95
-
96
-
97
-
98
-
99
-
100
-
101
-
102
-
103
-
104
-
105
-
106
-
107
-
108
-
109
-
110
-
111
-
112
-
113
-
114
-
115
-
116
-
117
-
118
-
119
-
120
-
121
-
122
-
123
-
124
-
125
-
126
-
127
-
128
-
129
-
130
 |
 |

GENERAL MOTORS COMPANY AND SUBSIDIARIES
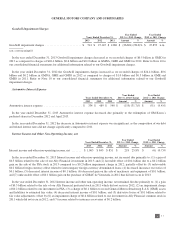
Gain (Loss) on Extinguishment of Debt
Years Ended December 31,
Year Ended
2013 vs. 2012 Change
Year Ended
2012 vs. 2011 Change
2013 2012 2011 Amount % Amount %
Gain (loss) on extinguishment of debt ............. $ (212) $ (250) $ 18 $ 38 15.2% $ (268) n.m.
n.m. = not meaningful
In the years ended December 31, 2013 and December 31, 2012 we recorded losses on extinguishment of debt primarily related to
the early redemption of the GM Korea redeemable preferred shares.
Equity Income and Gain on Investments
Years Ended December 31,
Year Ended
2013 vs. 2012 Change
Year Ended
2012 vs. 2011 Change
2013 2012 2011 Amount % Amount %
China joint ventures (China JVs) ................. $ 1,763 $ 1,521 $ 1,511 $ 242 15.9% $ 10 0.7%
New Delphi (including gain on disposition) ........ — — 1,727 — n.m. (1,727) n.m.
Others ...................................... 47 41 (46) 6 14.6% 87 n.m.
Total equity income and gain on investments ....... $ 1,810 $ 1,562 $ 3,192 $ 248 15.9% $ (1,630) (51.1)%
n.m. = not meaningful
In the year ended December 31, 2013 Equity income and gain on investments increased due primarily to a $0.2 billion increase in
earnings of our China JVs.
In the year ended December 31, 2012 Equity income and gain on investments decreased due primarily to a $1.6 billion gain related
to the sale of our Delphi Automotive LLP (New Delphi) Class A Membership Interests and related equity income for the year ended
December 31, 2011 that did not recur for the year ended December 31, 2012.
Income Tax Expense (Benefit)
Years Ended December 31,
Year Ended
2013 vs. 2012 Change
Year Ended
2012 vs. 2011 Change
2013 2012 2011 Amount % Amount %
Income tax expense (benefit) ..................... $ 2,127 $ (34,831) $ (110) $ 36,958 n.m. $ (34,721) n.m.
n.m. = not meaningful
In the year ended December 31, 2013 our effective tax rate was 28.5%. Income tax expense increased due primarily to the deferred
tax asset valuation allowance reversal of $36.3 billion in the U.S. and Canada that occurred in 2012.
In the year ended December 31, 2012 income tax benefit increased due primarily to: (1) deferred tax asset valuation allowance
reversals of $36.3 billion in the U.S. and Canada in 2012 as compared to $0.5 billion in Australia in 2011; and (2) change in U.S.
federal tax elections which permitted us to record a tax benefit of $1.1 billion related to foreign tax credits; partially offset by
(3) current year U.S. income tax provision of $1.4 billion; and (4) income tax allocation from Accumulated other comprehensive loss
to Income tax expense (benefit) of $0.6 billion related to the U.S. salary pension plan.
Refer to Note 18 to our consolidated financial statements for additional information related to our income tax expense (benefit).
24
2013 ANNUAL REPORT