General Motors 2013 Annual Report Download - page 29
Download and view the complete annual report
Please find page 29 of the 2013 General Motors annual report below. You can navigate through the pages in the report by either clicking on the pages listed below, or by using the keyword search tool below to find specific information within the annual report.-
 1
1 -
2
-
3
-
4
-
5
-
6
-
7
-
8
-
9
-
10
-
11
-
12
-
13
-
14
-
15
-
16
-
17
-
18
-
 19
19 -
 20
20 -
 21
21 -
 22
22 -
 23
23 -
 24
24 -
 25
25 -
 26
26 -
 27
27 -
 28
28 -
 29
29 -
 30
30 -
 31
31 -
 32
32 -
 33
33 -
 34
34 -
 35
35 -
 36
36 -
 37
37 -
 38
38 -
 39
39 -
40
-
41
-
42
-
43
-
44
-
45
-
46
-
47
-
48
-
49
-
50
-
51
-
52
-
53
-
54
-
55
-
56
-
57
-
58
-
59
-
60
-
61
-
62
-
63
-
64
-
65
-
66
-
67
-
68
-
69
-
70
-
71
-
72
-
73
-
74
-
75
-
76
-
77
-
78
-
79
-
80
-
81
-
82
-
83
-
84
-
85
-
86
-
87
-
88
-
89
-
90
-
91
-
92
-
93
-
94
-
95
-
96
-
97
-
98
-
99
-
100
-
101
-
102
-
103
-
104
-
105
-
106
-
107
-
108
-
109
-
110
-
111
-
112
-
113
-
114
-
115
-
116
-
117
-
118
-
119
-
120
-
121
-
122
-
123
-
124
-
125
-
126
-
127
-
128
-
129
-
130
 |
 |

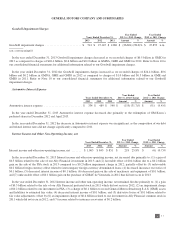
GENERAL MOTORS COMPANY AND SUBSIDIARIES
Year Ended December 31, 2012
GMNA GME GMIO GMSA Corporate Total
Goodwill impairment charges ................................ $ (26,399) $ (590) $ (132) $ — $ — $ (27,121)
Impairment charges of property ............................... — (3,714) — — — (3,714)
Pension settlement charges ................................... (2,662) — — — — (2,662)
Impairment charges of intangible assets ......................... — (1,755) — — — (1,755)
Premium paid to purchase our common stock from the UST ........ — — — — (402) (402)
GM Korea wage litigation accrual ............................. — — (336) — — (336)
Impairment charge related to investment in PSA .................. — (220) — — — (220)
Income related to insurance recoveries ......................... 9 7 112 27 — 155
Charge to record GMS assets and liabilities to estimated fair value . . . — (119) — — — (119)
Noncontrolling interests related to redemption of the GM Korea
mandatorily redeemable preferred shares ...................... — — 68 — — 68
Total adjustments to automotive EBIT .......................... $ (29,052) $ (6,391) $ (288) $ 27 $ (402) $ (36,106)
Year Ended December 31, 2011
GMNA GME GMIO GMSA Corporate Total
Gain on sale of our New Delphi Class A Membership Interests ...... $ 1,645 $ — $ — $ — $ — $ 1,645
Goodwill impairment charges ................................ — (1,016) (258) — — (1,274)
Gain related to HCT settlement ............................... 749 — — — — 749
Impairment related to Ally Financial common stock ............... — — — — (555) (555)
Gain on sale of Ally Financial preferred stock .................... — — — — 339 339
Charges related to GM India ................................. — — (106) — — (106)
Gain on extinguishment of debt ............................... — — — 63 — 63
Total adjustments to automotive EBIT .......................... $ 2,394 $ (1,016) $ (364) $ 63 $ (216) $ 861
GM North America
Years Ended December 31,
Year Ended
2013 vs. 2012 Change Variance Due To
2013 2012
Favorable/
(Unfavorable) % Volume Mix Price Other Total
(Dollars in millions) (Dollars in billions)
Total net sales and revenue ..... $ 95,099 $ 89,910 $ 5,189 5.8% $ 1.7 $ 1.3 $ 1.9 $ 0.3 $ 5.2
EBIT-adjusted ............... $ 7,461 $ 6,470 $ 991 15.3% $ 0.5 $ — $ 1.9 $ (1.4) $ 1.0
(Vehicles in thousands)
Wholesale vehicle sales ........ 3,276 3,207 69 2.2%
Years Ended December 31,
Year Ended
2012 vs. 2011 Change Variance Due To
2012 2011
Favorable/
(Unfavorable) % Volume Mix Price Other Total
(Dollars in millions) (Dollars in billions)
Total net sales and revenue ..... $ 89,910 $ 85,991 $ 3,919 4.6% $ 3.8 $ 0.7 $ 0.5 $ (1.1) $ 3.9
EBIT-adjusted ............... $ 6,470 $ 6,779 $ (309) (4.6)% $ 1.1 $ (0.6) $ 0.5 $ (1.3) $ (0.3)
(Vehicles in thousands)
Wholesale vehicle sales ........ 3,207 3,053 154 5.0%
GMNA Total Net Sales and Revenue
In the year ended December 31, 2013 Total net sales and revenue increased due primarily to: (1) favorable vehicle pricing related to
recent vehicle launches such as Chevrolet Silverado and GMC Sierra; (2) increased wholesale volumes due to increased industry
27