Humana 2005 Annual Report Download - page 101
Download and view the complete annual report
Please find page 101 of the 2005 Humana annual report below. You can navigate through the pages in the report by either clicking on the pages listed below, or by using the keyword search tool below to find specific information within the annual report.-
 1
1 -
2
-
3
-
4
-
5
-
6
-
7
-
8
-
9
-
10
-
11
-
12
-
13
-
14
-
15
-
16
-
17
-
18
-
19
-
20
-
21
-
22
-
23
-
24
-
25
-
26
-
27
-
28
-
29
-
30
-
31
-
32
-
33
-
34
-
35
-
36
-
37
-
38
-
39
-
40
-
41
-
42
-
43
-
44
-
45
-
46
-
47
-
48
-
49
-
50
-
51
-
52
-
53
-
54
-
55
-
56
-
57
-
58
-
59
-
60
-
61
-
62
-
63
-
64
-
65
-
66
-
67
-
68
-
69
-
70
-
71
-
72
-
73
-
74
-
75
-
76
-
77
-
78
-
79
-
80
-
81
-
82
-
83
-
84
-
85
-
86
-
87
-
88
-
89
-
90
-
 91
91 -
 92
92 -
 93
93 -
 94
94 -
 95
95 -
 96
96 -
 97
97 -
 98
98 -
 99
99 -
 100
100 -
 101
101 -
 102
102 -
 103
103 -
 104
104 -
 105
105 -
 106
106 -
 107
107 -
 108
108 -
 109
109 -
 110
110 -
 111
111 -
112
-
113
-
114
-
115
-
116
-
117
-
118
-
119
-
120
-
121
-
122
-
123
-
124
-
125
-
126
-
127
-
128
 |
 |

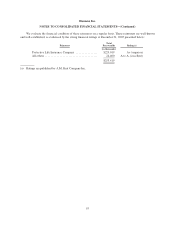
Humana Inc.
NOTES TO CONSOLIDATED FINANCIAL STATEMENTS—(Continued)
and specialty. We identified our segments in accordance with the aggregation provisions of SFAS 131 which is
consistent with information used by our Chief Executive Officer in managing our business. The segment
information aggregates products with similar economic characteristics. These characteristics include the nature of
customer groups and pricing, benefits and underwriting requirements.
The accounting policies of each segment are the same and are described in Note 2. The results of each
segment are measured by income before income taxes. We allocate all selling, general and administrative
expenses, investment and other income, interest expense, and goodwill, but no other assets or liabilities, to our
segments. Members served by our two segments often utilize the same medical provider networks, enabling us to
obtain more favorable contract terms with providers. Our segments also share overhead costs and assets. As a
result, the profitability of each segment is interdependent.
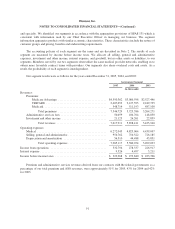
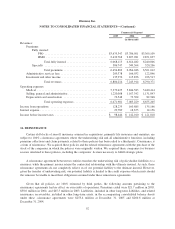
Our segment results were as follows for the years ended December 31, 2005, 2004, and 2003:
Government Segment
2005 2004 2003
(in thousands)
Revenues:
Premiums:
Medicare Advantage ................................. $4,590,362 $3,086,598 $2,527,446
TRICARE ......................................... 2,407,653 2,127,595 2,249,725
Medicaid .......................................... 548,714 511,193 487,100
Total premiums ................................. 7,546,729 5,725,386 5,264,271
Administrative services fees ............................... 50,059 106,764 148,830
Investment and other income .............................. 21,123 26,261 22,839
Total revenues .................................. 7,617,911 5,858,411 5,435,940
Operating expenses:
Medical ............................................... 6,272,045 4,825,064 4,439,007
Selling, general and administrative .......................... 956,762 710,522 726,185
Depreciation and amortization ............................. 56,310 44,488 43,831
Total operating expenses .......................... 7,285,117 5,580,074 5,209,023
Income from operations ...................................... 332,794 278,337 226,917
Interest expense ............................................. 9,526 4,497 3,211
Income before income taxes ................................... $ 323,268 $ 273,840 $ 223,706
Premium and administrative services revenues derived from our contracts with the federal government, as a
percentage of our total premium and ASO revenues, were approximately 51% for 2005, 43% for 2004 and 42%
for 2003.
91