Humana 2005 Annual Report Download - page 50
Download and view the complete annual report
Please find page 50 of the 2005 Humana annual report below. You can navigate through the pages in the report by either clicking on the pages listed below, or by using the keyword search tool below to find specific information within the annual report.-
 1
1 -
2
-
3
-
4
-
5
-
6
-
7
-
8
-
9
-
10
-
11
-
12
-
13
-
14
-
15
-
16
-
17
-
18
-
19
-
20
-
21
-
22
-
23
-
24
-
25
-
26
-
27
-
28
-
29
-
30
-
31
-
32
-
33
-
34
-
35
-
36
-
37
-
38
-
39
-
 40
40 -
 41
41 -
 42
42 -
 43
43 -
 44
44 -
 45
45 -
 46
46 -
 47
47 -
 48
48 -
 49
49 -
 50
50 -
 51
51 -
 52
52 -
 53
53 -
 54
54 -
 55
55 -
 56
56 -
 57
57 -
 58
58 -
 59
59 -
 60
60 -
61
-
62
-
63
-
64
-
65
-
66
-
67
-
68
-
69
-
70
-
71
-
72
-
73
-
74
-
75
-
76
-
77
-
78
-
79
-
80
-
81
-
82
-
83
-
84
-
85
-
86
-
87
-
88
-
89
-
90
-
91
-
92
-
93
-
94
-
95
-
96
-
97
-
98
-
99
-
100
-
101
-
102
-
103
-
104
-
105
-
106
-
107
-
108
-
109
-
110
-
111
-
112
-
113
-
114
-
115
-
116
-
117
-
118
-
119
-
120
-
121
-
122
-
123
-
124
-
125
-
126
-
127
-
128
 |
 |

higher average outstanding debt balance increased interest expense $5.0 million during 2005. The average
interest rate during 2005 of 5.3% increased 140 basis points compared to 3.9% during 2004.
Income Taxes
Our effective tax rate in 2005 of 26.9% decreased 5.8% compared to the 32.7% effective tax rate in 2004.
The effective tax rate for 2005 reflects the favorable impact from the resolution of a contingent tax gain of $22.8
million during the first quarter of 2005 in connection with the expiration of the statute of limitations on an
uncertain tax position related to the 2000 tax year. See Note 8 to the consolidated financial statements included in
Item 8.—Financial Statements and Supplementary Data for a complete reconciliation of the federal statutory rate
to the effective tax rate. We expect the 2006 effective tax rate to be in the range of 35% to 37%.
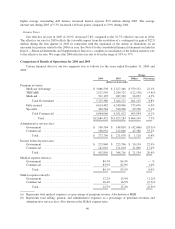
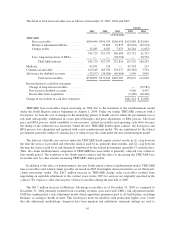
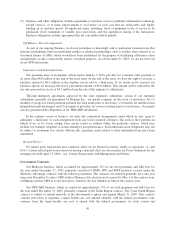
Comparison of Results of Operations for 2004 and 2003
Certain financial data for our two segments was as follows for the years ended December 31, 2004 and
2003:
Change
2004 2003 Dollars Percentage
(dollars in thousands)
Premium revenues:
Medicare Advantage .......................... $ 3,086,598 $ 2,527,446 $ 559,152 22.1%
TRICARE .................................. 2,127,595 2,249,725 (122,130) (5.4)%
Medicaid ................................... 511,193 487,100 24,093 4.9%
Total Government ........................ 5,725,386 5,264,271 461,115 8.8%
Fully insured ................................ 6,614,482 6,240,806 373,676 6.0%
Specialty .................................... 349,564 320,206 29,358 9.2%
Total Commercial ........................ 6,964,046 6,561,012 403,034 6.1%
Total ............................... $12,689,432 $11,825,283 $ 864,149 7.3%
Administrative services fees:
Government ................................. $ 106,764 $ 148,830 $ (42,066) (28.3)%
Commercial ................................. 166,032 122,846 43,186 35.2%
Total ................................... $ 272,796 $ 271,676 $ 1,120 0.4%
Income before income taxes:
Government ................................. $ 273,840 $ 223,706 $ 50,134 22.4%
Commercial ................................. 142,010 121,010 21,000 17.4%
Total ................................... $ 415,850 $ 344,716 $ 71,134 20.6%
Medical expense ratios(a):
Government ................................. 84.3% 84.3% — %
Commercial ................................. 83.9% 82.9% 1.0%
Total ................................... 84.1% 83.5% 0.6%
SG&A expense ratios(b):
Government ................................. 12.2% 13.4% (1.2)%
Commercial ................................. 16.4% 16.9% (0.5)%
Total ................................... 14.5% 15.4% (0.9)%
(a) Represents total medical expenses as a percentage of premium revenue. Also known as MER.
(b) Represents total selling, general, and administrative expenses as a percentage of premium revenues and
administrative services fees. Also known as the SG&A expense ratio.
40