Humana 2005 Annual Report Download - page 47
Download and view the complete annual report
Please find page 47 of the 2005 Humana annual report below. You can navigate through the pages in the report by either clicking on the pages listed below, or by using the keyword search tool below to find specific information within the annual report.-
 1
1 -
2
-
3
-
4
-
5
-
6
-
7
-
8
-
9
-
10
-
11
-
12
-
13
-
14
-
15
-
16
-
17
-
18
-
19
-
20
-
21
-
22
-
23
-
24
-
25
-
26
-
27
-
28
-
29
-
30
-
31
-
32
-
33
-
34
-
35
-
36
-
 37
37 -
 38
38 -
 39
39 -
 40
40 -
 41
41 -
 42
42 -
 43
43 -
 44
44 -
 45
45 -
 46
46 -
 47
47 -
 48
48 -
 49
49 -
 50
50 -
 51
51 -
 52
52 -
 53
53 -
 54
54 -
 55
55 -
 56
56 -
 57
57 -
58
-
59
-
60
-
61
-
62
-
63
-
64
-
65
-
66
-
67
-
68
-
69
-
70
-
71
-
72
-
73
-
74
-
75
-
76
-
77
-
78
-
79
-
80
-
81
-
82
-
83
-
84
-
85
-
86
-
87
-
88
-
89
-
90
-
91
-
92
-
93
-
94
-
95
-
96
-
97
-
98
-
99
-
100
-
101
-
102
-
103
-
104
-
105
-
106
-
107
-
108
-
109
-
110
-
111
-
112
-
113
-
114
-
115
-
116
-
117
-
118
-
119
-
120
-
121
-
122
-
123
-
124
-
125
-
126
-
127
-
128
 |
 |
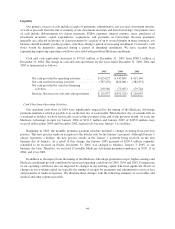
Summary
Net income was $308.5 million, or $1.87 per diluted common share, in 2005 compared to $280.0 million, or
$1.72 per diluted common share, in 2004. The increase in net income primarily resulted from improved profits in
our Government segment, driven by gains in membership and improved underwriting results in both our
Medicare and TRICARE operations.
Net income for 2005 included expenses resulting from the class action litigation settlement ($44.8 million
after taxes, or $0.27 per diluted common share) and costs associated with Hurricane Katrina ($16.9 million after
taxes, or $0.10 per diluted common share). Net income for 2005 also included the favorable effect of an effective
tax rate of approximately 26.9% compared to 32.7% in 2004, primarily due to the resolution of a contingent tax
gain ($22.8 million, or $0.14 per diluted common share) during the first quarter of 2005 in connection with the
expiration of the statute of limitations on an uncertain tax position related to the 2000 tax year.
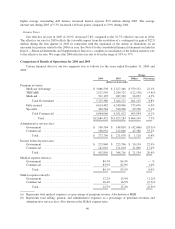
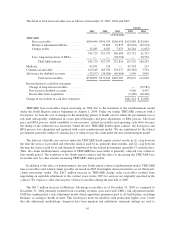
Premium Revenues and Medical Membership
Premium revenues increased 10.3% to $14.0 billion for 2005, compared to $12.7 billion for 2004. Higher
Government segment premium revenues were partially offset by a decrease in Commercial segment premium
revenues. Premium revenues reflect changes in membership and increases in average per member premiums.
Items impacting average per member premiums include changes in premium rates as well as changes in the
geographic mix of membership, the mix of product offerings, and the mix of benefit plans selected by our
membership.
Government segment premium revenues increased 31.8% to $7.5 billion for 2005, compared to $5.7 billion
for 2004. This increase primarily was attributable to our Medicare Advantage operations and the effects of
transitioning to the TRICARE South contract during 2004. Medicare Advantage membership was 557,800 at
December 31, 2005, compared to 377,200 at December 31, 2004, an increase of 180,600 members, or 47.9%.
This increase was due to expanded participation in various Medicare Advantage programs and geographic
markets, as well as the CarePlus acquisition. The February 16, 2005 CarePlus acquisition added 50,400 members
and $486.3 million in premium revenues in 2005. Average per member premiums for our Medicare Advantage
business increased approximately 12% during 2005. This reflects a shift in our Medicare membership mix to
higher reimbursement markets, due primarily to the South Florida CarePlus acquisition. Medicare geographic
expansions during 2006 are anticipated to contribute to continued enrollment growth, with projected Medicare
Advantage enrollment in the range of 900,000 to 1,100,000 at December 31, 2006 and PDP enrollment in the
range of 1,900,000 to 2,200,000 at December 31, 2006. Total Medicare premium revenue for 2006 is projected to
more than double from 2005. TRICARE premium revenues increased 13.2% in 2005, reflecting the transition to
the new South Region contract during 2004 which included a temporary loss of approximately 1 million
members for 4 months in 2004. Medicaid membership declined by 20,700 members from December 31, 2004 to
December 31, 2005 primarily due to the fact that we did not renew our participation in the Medicaid program for
the State of Illinois on July 31, 2005. The Illinois Medicaid business was not material to our results of operations,
financial position, or cash flows.
Commercial segment premium revenues decreased 7.3% to $6.5 billion for 2005, compared to $7.0 billion
for 2004. Lower premium revenues primarily resulted from a reduction of fully insured membership partially
offset by increases in average per member premiums. Our fully insured membership decreased 12.5%, or
286,700 members, to 1,999,800 at December 31, 2005 compared to 2,286,500 at December 31, 2004. The
decrease is primarily due to the relinquishment of an 89,000-member unprofitable account on January 1, 2005
and continued attrition due to the ongoing competitive environment within the fully insured group accounts,
partially offset by membership gains in the individual and consumer-choice product lines. Average per member
premiums for our fully insured group medical members increased approximately 7% to 9% in 2005 and are
anticipated to further increase in the range of 7% to 9% in 2006.
37