Humana 2005 Annual Report Download - page 59
Download and view the complete annual report
Please find page 59 of the 2005 Humana annual report below. You can navigate through the pages in the report by either clicking on the pages listed below, or by using the keyword search tool below to find specific information within the annual report.-
 1
1 -
2
-
3
-
4
-
5
-
6
-
7
-
8
-
9
-
10
-
11
-
12
-
13
-
14
-
15
-
16
-
17
-
18
-
19
-
20
-
21
-
22
-
23
-
24
-
25
-
26
-
27
-
28
-
29
-
30
-
31
-
32
-
33
-
34
-
35
-
36
-
37
-
38
-
39
-
40
-
41
-
42
-
43
-
44
-
45
-
46
-
47
-
48
-
 49
49 -
 50
50 -
 51
51 -
 52
52 -
 53
53 -
 54
54 -
 55
55 -
 56
56 -
 57
57 -
 58
58 -
 59
59 -
 60
60 -
 61
61 -
 62
62 -
 63
63 -
 64
64 -
 65
65 -
 66
66 -
 67
67 -
 68
68 -
 69
69 -
70
-
71
-
72
-
73
-
74
-
75
-
76
-
77
-
78
-
79
-
80
-
81
-
82
-
83
-
84
-
85
-
86
-
87
-
88
-
89
-
90
-
91
-
92
-
93
-
94
-
95
-
96
-
97
-
98
-
99
-
100
-
101
-
102
-
103
-
104
-
105
-
106
-
107
-
108
-
109
-
110
-
111
-
112
-
113
-
114
-
115
-
116
-
117
-
118
-
119
-
120
-
121
-
122
-
123
-
124
-
125
-
126
-
127
-
128
 |
 |

subject to regulatory restrictions. Cash, cash equivalents and short-term investments at the parent company
decreased $19.7 million to $419.6 million at December 31, 2005 compared to $439.3 million at December 31,
2004 reflecting the use of parent company cash for acquisition activity during 2005. See Schedule I to this Form
10-K beginning on page 107 for our parent company only financial information.
Regulatory Requirements
Certain of our subsidiaries operate in states that regulate the payment of dividends, loans, or other cash
transfers to Humana Inc., our parent company, and require minimum levels of equity as well as limit investments
to approved securities. The amount of dividends that may be paid to Humana Inc. by these subsidiaries, without
prior approval by state regulatory authorities, is limited based on the entity’s level of statutory income and
statutory capital and surplus. In most states, prior notification is provided before paying a dividend even if
approval is not required.
As of December 31, 2005, we maintained aggregate statutory capital and surplus of $1,203.2 million in our
state regulated subsidiaries. Each of these subsidiaries was in compliance with applicable statutory requirements
which aggregated $722.2 million. Although the minimum required levels of equity are largely based on premium
volume, product mix, and the quality of assets held, minimum requirements can vary significantly at the state
level. Given our anticipated premium growth in 2006 resulting from the expansion of our Medicare products,
capital requirements will increase. We expect to fund these increased requirements with capital contributions
from Humana Inc., our parent company, in the range of $450 million to $650 million in 2006.
Most states rely on risk-based capital requirements, or RBC, to define the required levels of equity. RBC is a
model developed by the National Association of Insurance Commissioners to monitor an entity’s solvency. This
calculation indicates recommended minimum levels of required capital and surplus and signals regulatory
measures should actual surplus fall below these recommended levels. If RBC were adopted by all states and
Puerto Rico at December 31, 2005, we would be required to fund $14.7 million in one of our Puerto Rico
subsidiaries to meet all requirements. After this funding, we would have $378.2 million of aggregate capital and
surplus above any of the levels that require corrective action under RBC.
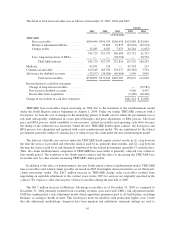
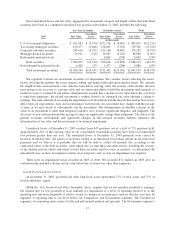
Contractual Obligations
We are contractually obligated to make payments for years subsequent to December 31, 2005 as follows:
Payments Due by Period
Total
Less than
1 Year 1-3 Years 3-5 Years
More than
5 Years
(in thousands)
Debt ...................................... $ 803,640 $300,574 $ 1,080 $201,080 $300,906
Interest(1) ................................. 285,720 50,333 66,900 45,396 123,091
Operating leases(2) .......................... 297,113 84,993 121,622 62,325 28,173
Purchase and other obligations(3) ............... 46,433 24,044 18,346 4,043 —
Total ............................. $1,432,906 $459,944 $207,948 $312,844 $452,170
(1) Interest includes the estimated contractual interest payments under our debt agreements net of the effect of
the associated swap agreements assuming no change in the LIBOR rate as of December 31, 2005.
(2) We lease facilities, computer hardware, and other equipment under long-term operating leases that are
noncancelable and expire on various dates through 2023. We sublease facilities or partial facilities to third
party tenants for space not used in our operations which partially mitigates our operating lease
commitments. An operating lease, accounted for under the provisions of SFAS No. 13, Accounting for
Leases, is a type of off-balance sheet arrangement. Assuming we acquired the asset, rather than leased such
asset, we would have recognized a liability for the financing of these assets. See also Note 14 to the
consolidated financial statements included in Item 8.—Financial Statements and Supplementary Data.
49