Humana 2005 Annual Report Download - page 56
Download and view the complete annual report
Please find page 56 of the 2005 Humana annual report below. You can navigate through the pages in the report by either clicking on the pages listed below, or by using the keyword search tool below to find specific information within the annual report.-
 1
1 -
2
-
3
-
4
-
5
-
6
-
7
-
8
-
9
-
10
-
11
-
12
-
13
-
14
-
15
-
16
-
17
-
18
-
19
-
20
-
21
-
22
-
23
-
24
-
25
-
26
-
27
-
28
-
29
-
30
-
31
-
32
-
33
-
34
-
35
-
36
-
37
-
38
-
39
-
40
-
41
-
42
-
43
-
44
-
45
-
 46
46 -
 47
47 -
 48
48 -
 49
49 -
 50
50 -
 51
51 -
 52
52 -
 53
53 -
 54
54 -
 55
55 -
 56
56 -
 57
57 -
 58
58 -
 59
59 -
 60
60 -
 61
61 -
 62
62 -
 63
63 -
 64
64 -
 65
65 -
 66
66 -
67
-
68
-
69
-
70
-
71
-
72
-
73
-
74
-
75
-
76
-
77
-
78
-
79
-
80
-
81
-
82
-
83
-
84
-
85
-
86
-
87
-
88
-
89
-
90
-
91
-
92
-
93
-
94
-
95
-
96
-
97
-
98
-
99
-
100
-
101
-
102
-
103
-
104
-
105
-
106
-
107
-
108
-
109
-
110
-
111
-
112
-
113
-
114
-
115
-
116
-
117
-
118
-
119
-
120
-
121
-
122
-
123
-
124
-
125
-
126
-
127
-
128
 |
 |

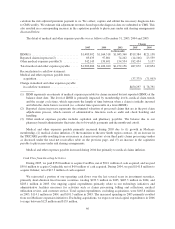
calculate the risk adjusted premium payment to us. We collect, capture and submit the necessary diagnosis data
to CMS weekly. We estimate risk adjustment revenues based upon the diagnosis data we submitted to CMS. This
also resulted in a corresponding increase in the capitation payable to physicians under risk sharing arrangements
discussed below.
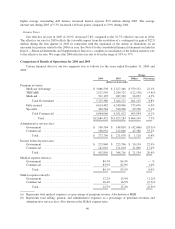
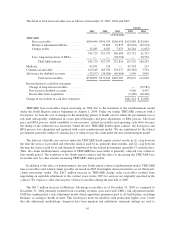
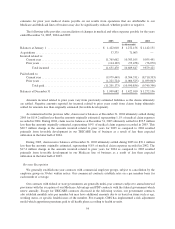
The detail of medical and other expenses payable was as follows at December 31, 2005, 2004 and 2003:
Change
2005 2004 2003 2005 2004
(in thousands)
IBNR(1)................................ $1,483,902 $1,164,518 $1,043,360 $319,384 $121,158
Reported claims in process(2) ............... 83,635 97,801 74,262 (14,166) 23,539
Other medical expenses payable(3) .......... 342,145 159,691 154,534 182,454 5,157
Total medical and other expenses payable ..... $1,909,682 $1,422,010 $1,272,156 487,672 149,854
Reconciliation to cash flow statement:
Medical and other expenses payable from
acquisition ............................ (37,375) (71,063)
Change in medical and other expenses payable
in cash flow statement ................... $450,297 $ 78,791
(1) IBNR represents an estimate of medical expenses payable for claims incurred but not reported (IBNR) at the
balance sheet date. The level of IBNR is primarily impacted by membership levels, medical claim trends
and the receipt cycle time, which represents the length of time between when a claim is initially incurred
and when the claim form is received (i.e. a shorter time span results in a lower IBNR).
(2) Reported claims in process represents the estimated valuation of processed claims that are in the post claim
adjudication process, which consists of administrative functions such as audit and check batching and
handling.
(3) Other medical expenses payable includes capitation and pharmacy payables. The balance due to our
pharmacy benefit administrator fluctuates due to bi-weekly payments and the month-end cutoff.
Medical and other expenses payable primarily increased during 2005 due to (1) growth in Medicare
membership, (2) medical claims inflation, (3) the transition to the new South region contract, (4) an increase in
the TRICARE payable resulting from an increase in claims inventory at our third party claims processing vendor
as discussed under the total net receivables table on the previous page, and (5) an increase in the capitation
payable to physicians under risk sharing arrangements.
Medical and other expenses payable increased during 2004 due primarily to medical claims inflation.
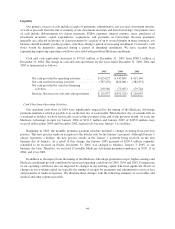
Cash Flow from Investing Activities
During 2005, we paid $352.8 million to acquire CarePlus, net of $92.1 million of cash acquired, and we paid
$50.0 million to acquire Corphealth, net of $4.0 million of cash acquired. During 2004, we paid $141.8 million to
acquire Ochsner, net of $15.3 million of cash acquired.
We reinvested a portion of our operating cash flows over the last several years in investment securities,
primarily short-duration fixed income securities, totaling $233.3 million in 2005, $407.3 million in 2004, and
$283.1 million in 2003. Our ongoing capital expenditures primarily relate to our technology initiatives and
administrative facilities necessary for activities such as claims processing, billing and collections, medical
utilization review, and customer service. Total capital expenditures, excluding acquisitions, were $165.8 million
in 2005, $114.1 million in 2004, and $101.3 million in 2003. The increased spending in 2005 primarily resulted
from our Medicare expansion initiatives. Excluding acquisitions, we expect our total capital expenditures in 2006
to range between $125 million and $135 million.
46