Humana 2005 Annual Report Download - page 46
Download and view the complete annual report
Please find page 46 of the 2005 Humana annual report below. You can navigate through the pages in the report by either clicking on the pages listed below, or by using the keyword search tool below to find specific information within the annual report.-
 1
1 -
2
-
3
-
4
-
5
-
6
-
7
-
8
-
9
-
10
-
11
-
12
-
13
-
14
-
15
-
16
-
17
-
18
-
19
-
20
-
21
-
22
-
23
-
24
-
25
-
26
-
27
-
28
-
29
-
30
-
31
-
32
-
33
-
34
-
35
-
 36
36 -
 37
37 -
 38
38 -
 39
39 -
 40
40 -
 41
41 -
 42
42 -
 43
43 -
 44
44 -
 45
45 -
 46
46 -
 47
47 -
 48
48 -
 49
49 -
 50
50 -
 51
51 -
 52
52 -
 53
53 -
 54
54 -
 55
55 -
 56
56 -
57
-
58
-
59
-
60
-
61
-
62
-
63
-
64
-
65
-
66
-
67
-
68
-
69
-
70
-
71
-
72
-
73
-
74
-
75
-
76
-
77
-
78
-
79
-
80
-
81
-
82
-
83
-
84
-
85
-
86
-
87
-
88
-
89
-
90
-
91
-
92
-
93
-
94
-
95
-
96
-
97
-
98
-
99
-
100
-
101
-
102
-
103
-
104
-
105
-
106
-
107
-
108
-
109
-
110
-
111
-
112
-
113
-
114
-
115
-
116
-
117
-
118
-
119
-
120
-
121
-
122
-
123
-
124
-
125
-
126
-
127
-
128
 |
 |

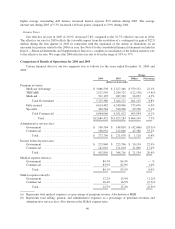
Comparison of Results of Operations for 2005 and 2004
Certain financial data for our two segments was as follows for the years ended December 31, 2005 and
2004:
Change
2005 2004 Dollars Percentage
(dollars in thousands)
Premium revenues:
Medicare Advantage .................................. $ 4,590,362 $ 3,086,598 $1,503,764 48.7%
TRICARE .......................................... 2,407,653 2,127,595 280,058 13.2%
Medicaid ........................................... 548,714 511,193 37,521 7.3%
Total Government ................................ 7,546,729 5,725,386 1,821,343 31.8%
Fully insured ........................................ 6,068,115 6,614,482 (546,367) (8.3)%
Specialty ........................................... 386,747 349,564 37,183 10.6%
Total Commercial ................................ 6,454,862 6,964,046 (509,184) (7.3)%
Total ...................................... $14,001,591 $12,689,432 $1,312,159 10.3%
Administrative services fees:
Government ......................................... $ 50,059 $ 106,764 $ (56,705) (53.1)%
Commercial ......................................... 209,378 166,032 43,346 26.1%
Total .......................................... $ 259,437 $ 272,796 $ (13,359) (4.9)%
Income before income taxes:
Government ......................................... $ 323,268 $ 273,840 $ 49,428 18.0%
Commercial ......................................... 98,446 142,010 (43,564) (30.7)%
Total .......................................... $ 421,714 $ 415,850 $ 5,864 1.4%
Medical expense ratios(a):
Government ......................................... 83.1% 84.3% (1.2)%
Commercial ......................................... 83.3% 83.9% (0.6)%
Total .......................................... 83.2% 84.1% (0.9)%
SG&A expense ratios(b):
Government ......................................... 12.6% 12.2% 0.4%
Commercial ......................................... 18.3% 16.4% 1.9%
Total .......................................... 15.3% 14.5% 0.8%
(a) Represents total medical expenses as a percentage of premium revenue. Also known as MER.
(b) Represents total selling, general, and administrative expenses as a percentage of premium revenues and administrative
services fees. Also known as the SG&A expense ratio.
Medical membership was as follows at December 31, 2005 and 2004:
Change
2005 2004 Members Percentage
Government segment medical members:
Medicare Advantage ........................................ 557,800 377,200 180,600 47.9%
Medicaid ................................................. 457,900 478,600 (20,700) (4.3)%
TRICARE ................................................ 1,750,900 1,789,400 (38,500) (2.2)%
TRICARE ASO ........................................... 1,138,200 1,082,400 55,800 5.2%
Total Government ...................................... 3,904,800 3,727,600 177,200 4.8%
Commercial segment medical members:
Fully insured .............................................. 1,999,800 2,286,500 (286,700) (12.5)%
ASO .................................................... 1,171,000 1,018,600 152,400 15.0%
Total Commercial ...................................... 3,170,800 3,305,100 (134,300) (4.1)%
Total medical membership ....................................... 7,075,600 7,032,700 42,900 0.6%
This table of financial data should be reviewed in connection with the discussion on the following pages.
36