Humana 2005 Annual Report Download - page 119
Download and view the complete annual report
Please find page 119 of the 2005 Humana annual report below. You can navigate through the pages in the report by either clicking on the pages listed below, or by using the keyword search tool below to find specific information within the annual report.-
 1
1 -
2
-
3
-
4
-
5
-
6
-
7
-
8
-
9
-
10
-
11
-
12
-
13
-
14
-
15
-
16
-
17
-
18
-
19
-
20
-
21
-
22
-
23
-
24
-
25
-
26
-
27
-
28
-
29
-
30
-
31
-
32
-
33
-
34
-
35
-
36
-
37
-
38
-
39
-
40
-
41
-
42
-
43
-
44
-
45
-
46
-
47
-
48
-
49
-
50
-
51
-
52
-
53
-
54
-
55
-
56
-
57
-
58
-
59
-
60
-
61
-
62
-
63
-
64
-
65
-
66
-
67
-
68
-
69
-
70
-
71
-
72
-
73
-
74
-
75
-
76
-
77
-
78
-
79
-
80
-
81
-
82
-
83
-
84
-
85
-
86
-
87
-
88
-
89
-
90
-
91
-
92
-
93
-
94
-
95
-
96
-
97
-
98
-
99
-
100
-
101
-
102
-
103
-
104
-
105
-
106
-
107
-
108
-
 109
109 -
 110
110 -
 111
111 -
 112
112 -
 113
113 -
 114
114 -
 115
115 -
 116
116 -
 117
117 -
 118
118 -
 119
119 -
 120
120 -
 121
121 -
 122
122 -
 123
123 -
 124
124 -
 125
125 -
 126
126 -
 127
127 -
 128
128
 |
 |

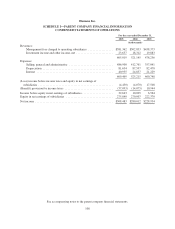
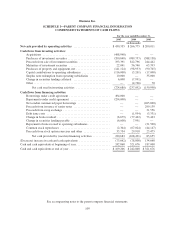
Humana Inc.
SCHEDULE I—PARENT COMPANY FINANCIAL INFORMATION
CONDENSED STATEMENTS OF CASH FLOWS
For the year ended December 31,
2005 2004 2003
(in thousands)
Net cash provided by operating activities ......................... $430,335 $ 266,775 $ 200,011
Cash flows from investing activities:
Acquisitions .............................................. (498,948) — —
Purchases of investment securities ............................. (200,048) (989,757) (388,138)
Proceeds from sale of investment securities ..................... 193,391 812,796 244,442
Maturities of investment securities ............................ 22,041 56,740 65,393
Purchases of property and equipment, net ....................... (141,124) (98,953) (90,765)
Capital contributions to operating subsidiaries ................... (116,000) (5,201) (17,000)
Surplus note redemption from operating subsidiaries .............. 10,000 — 35,000
Change in securities lending collateral ......................... 6,008 (7,991) —
Other .................................................... — (4,726) 70
Net cash used in investing activities ....................... (724,680) (237,092) (150,998)
Cash flows from financing activities:
Borrowings under credit agreement ............................ 494,000 — —
Repayments under credit agreement ........................... (294,000) — —
Net conduit commercial paper borrowings ...................... — — (265,000)
Proceeds from issuance of senior notes ......................... — — 299,139
Proceeds from swap exchange ................................ — — 31,556
Debt issue costs ........................................... — (1,954) (3,331)
Change in book overdraft .................................... (6,679) (77,422) 73,463
Change in securities lending payable ........................... (6,008) 7,991 —
Repayment of notes issued to operating subsidiaries ............... — — (31,500)
Common stock repurchases .................................. (2,364) (67,024) (44,147)
Proceeds from stock option exercises and other .................. 35,734 29,918 25,475
Net cash provided by (used in) financing activities ............ 220,683 (108,491) 85,655
(Decrease) increase in cash and cash equivalents ..................... (73,662) (78,808) 134,668
Cash and cash equivalents at beginning of year ....................... 242,868 321,676 187,008
Cash and cash equivalents at end of year ............................ $169,206 $ 242,868 $ 321,676
See accompanying notes to the parent company financial statements.
109