Humana 2005 Annual Report Download - page 53
Download and view the complete annual report
Please find page 53 of the 2005 Humana annual report below. You can navigate through the pages in the report by either clicking on the pages listed below, or by using the keyword search tool below to find specific information within the annual report.-
 1
1 -
2
-
3
-
4
-
5
-
6
-
7
-
8
-
9
-
10
-
11
-
12
-
13
-
14
-
15
-
16
-
17
-
18
-
19
-
20
-
21
-
22
-
23
-
24
-
25
-
26
-
27
-
28
-
29
-
30
-
31
-
32
-
33
-
34
-
35
-
36
-
37
-
38
-
39
-
40
-
41
-
42
-
 43
43 -
 44
44 -
 45
45 -
 46
46 -
 47
47 -
 48
48 -
 49
49 -
 50
50 -
 51
51 -
 52
52 -
 53
53 -
 54
54 -
 55
55 -
 56
56 -
 57
57 -
 58
58 -
 59
59 -
 60
60 -
 61
61 -
 62
62 -
 63
63 -
64
-
65
-
66
-
67
-
68
-
69
-
70
-
71
-
72
-
73
-
74
-
75
-
76
-
77
-
78
-
79
-
80
-
81
-
82
-
83
-
84
-
85
-
86
-
87
-
88
-
89
-
90
-
91
-
92
-
93
-
94
-
95
-
96
-
97
-
98
-
99
-
100
-
101
-
102
-
103
-
104
-
105
-
106
-
107
-
108
-
109
-
110
-
111
-
112
-
113
-
114
-
115
-
116
-
117
-
118
-
119
-
120
-
121
-
122
-
123
-
124
-
125
-
126
-
127
-
128
 |
 |
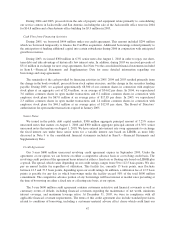
The Commercial segment’s MER for 2004 was 83.9%, increasing 100 basis points from 2003 of 82.9%. The
100 basis point increase was primarily due to underwriting losses associated with a large customer account
serving approximately 89,000 members and a competitive pricing environment in the 2 to 300 life customer
group. The 89,000-member large group account lapsed on January 1, 2005. Increasing per member premiums
commensurate with claims trend becomes more difficult in a competitive pricing environment.
SG&A Expense
Consolidated SG&A expenses increased $19.8 million, or 1.1%, to $1.9 billion in 2004. Included in 2003
were costs of $17.2 million from the impairment of the Jacksonville, Florida service center building more fully
described in Note 5 to the consolidated financial statements included in Item 8.—Financial Statements and
Supplementary Data. Excluding the impairment, the increase resulted from higher Commercial segment SG&A
expenses partially offset by lower Government segment SG&A expenses.
The consolidated SG&A expense ratio for 2004 was 14.5%, decreasing 90 basis points from 15.4% for
2003. This decrease, as well as the decrease in each of our segments’ SG&A expense ratios, was the result of the
revenue growth in excess of administrative cost inflation and operational efficiencies including gains from
completing the consolidation of seven service centers into four during 2003. The Jacksonville, Florida building
writedown increased the 2003 SG&A expense ratio 10 basis points.
SG&A expenses in the Government segment decreased $15.7 million, or 2.2% during 2004 primarily due to
a decrease in TRICARE SG&A expenses from transitioning to the South contract partially offset by the Ochsner
acquisition. The Government segment SG&A expense ratio decreased 120 basis points from 13.4% for 2003 to
12.2% for 2004. The Government segment SG&A expense ratio for 2003 included an approximate 20 basis point
impact from the Jacksonville, Florida building writedown.
The Commercial segment SG&A expenses increased $35.5 million, or 3.1% during 2004 primarily due to
the Ochsner acquisition. The Commercial segment SG&A expense ratio decreased 50 basis points from 16.9%
for 2003 to 16.4% for 2004. The Commercial segment SG&A expense ratio for 2003 included an approximate 10
basis point impact from the Jacksonville, Florida building writedown.
Depreciation and Amortization
Depreciation and amortization for 2004 totaled $117.8 million compared to $126.8 million for 2003, a
decrease of $9.0 million, or 7.1%. Accelerated depreciation from reducing the estimated useful life of software
increased depreciation expense $9.3 million in 2004 and $13.5 million in 2003. Amortization of other intangible
assets decreased when the other intangible assets allocated to an acquired TRICARE contract became fully
amortized in the second quarter of 2003. This was partially offset by the increased amortization expense
associated with other intangible assets recorded in connection with the April 1, 2004 Ochsner acquisition.
Interest Expense
Interest expense was $23.2 million for 2004, compared to $17.4 million for 2003, an increase of $5.8
million. This increase primarily resulted from higher average outstanding debt, due to the issuance of $300
million senior notes in August 2003.
Income Taxes
Our effective tax rate in 2004 of 32.7% decreased 0.9% compared to the 33.6% effective tax rate in 2003.
Our effective tax rate is lower than the federal statutory rate due primarily to tax-exempt investment income. See
Note 8 to the consolidated financial statements included in Item 8.—Financial Statements and Supplementary
Data for a complete reconciliation of the federal statutory rate to the effective tax rate.
43