Humana 2005 Annual Report Download - page 71
Download and view the complete annual report
Please find page 71 of the 2005 Humana annual report below. You can navigate through the pages in the report by either clicking on the pages listed below, or by using the keyword search tool below to find specific information within the annual report.-
 1
1 -
2
-
3
-
4
-
5
-
6
-
7
-
8
-
9
-
10
-
11
-
12
-
13
-
14
-
15
-
16
-
17
-
18
-
19
-
20
-
21
-
22
-
23
-
24
-
25
-
26
-
27
-
28
-
29
-
30
-
31
-
32
-
33
-
34
-
35
-
36
-
37
-
38
-
39
-
40
-
41
-
42
-
43
-
44
-
45
-
46
-
47
-
48
-
49
-
50
-
51
-
52
-
53
-
54
-
55
-
56
-
57
-
58
-
59
-
60
-
 61
61 -
 62
62 -
 63
63 -
 64
64 -
 65
65 -
 66
66 -
 67
67 -
 68
68 -
 69
69 -
 70
70 -
 71
71 -
 72
72 -
 73
73 -
 74
74 -
 75
75 -
 76
76 -
 77
77 -
 78
78 -
 79
79 -
 80
80 -
 81
81 -
82
-
83
-
84
-
85
-
86
-
87
-
88
-
89
-
90
-
91
-
92
-
93
-
94
-
95
-
96
-
97
-
98
-
99
-
100
-
101
-
102
-
103
-
104
-
105
-
106
-
107
-
108
-
109
-
110
-
111
-
112
-
113
-
114
-
115
-
116
-
117
-
118
-
119
-
120
-
121
-
122
-
123
-
124
-
125
-
126
-
127
-
128
 |
 |

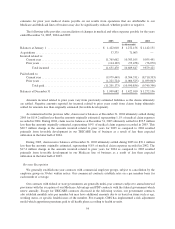
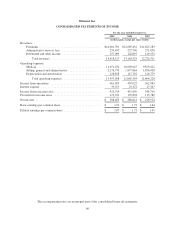
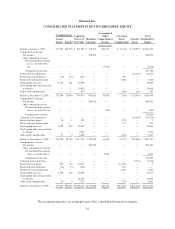
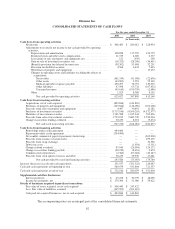
Humana Inc.
CONSOLIDATED STATEMENTS OF STOCKHOLDERS’ EQUITY
Common Stock Capital In
Excess of
Par Value
Retained
Earnings
Accumulated
Other
Comprehensive
Income
Unearned
Stock
Compensation
Treasury
Stock
Total
Stockholders’
Equity
Issued
Shares Amount
(in thousands)
Balances, January 1, 2003 ........ 171,335 $28,556 $ 931,089 $ 720,877 $22,455 $ (6,516) $ (89,987) $1,606,474
Comprehensive income:
Net income ................. — — — 228,934 — — — 228,934
Other comprehensive loss:
Net unrealized investment
losses, net of $(3,531)
tax .................... — — — — (5,546) — — (5,546)
Comprehensive income ...... 223,388
Common stock repurchases ...... — — — — — — (44,147) (44,147)
Restricted stock forfeitures ....... (72) (13) (527) — — 540 — —
Restricted stock amortization ..... — — — — — 5,808 — 5,808
Stock option exercises .......... 2,646 441 27,598 — — — — 28,039
Stock option and restricted stock
tax benefit .................. — — 15,858 — — — — 15,858
Other stock compensation ........ — — 957 — — (586) 158 529
Balances, December 31, 2003 ..... 173,909 28,984 974,975 949,811 16,909 (754) (133,976) 1,835,949
Comprehensive income:
Net income ................. — — — 280,012 — — — 280,012
Other comprehensive loss:
Net unrealized investment
losses, net of $(243) tax . . . — — — — (383) — — (383)
Comprehensive income ...... 279,629
Common stock repurchases ...... — — — — — — (67,024) (67,024)
Restricted stock grants .......... 10 2 295 — — (295) — 2
Restricted stock amortization ..... — — — — — 173 — 173
Stock option exercises .......... 2,099 350 29,613 — — — — 29,963
Stock option and restricted stock
tax benefit .................. — — 7,585 — — — — 7,585
Other stock compensation ........ 27 4 4,688 — — (845) — 3,847
Balances, December 31, 2004 ..... 176,045 29,340 1,017,156 1,229,823 16,526 (1,721) (201,000) 2,090,124
Comprehensive income:
Net income ................. — — — 308,483 — — — 308,483
Other comprehensive income:
Net unrealized investment
gains, net of $4,441 tax .... — — — — 8,306 — — 8,306
Comprehensive income ...... 316,789
Common stock repurchases ...... — — — — — — (2,364) (2,364)
Restricted stock grants .......... 495 83 16,318 — — (16,396) — 5
Restricted stock forfeitures ....... (16) (3) (504) — — 507 — —
Restricted stock amortization ..... — — — — — 4,454 — 4,454
Stock option exercises .......... 2,509 418 35,959 — — — — 36,377
Stock option and restricted stock
tax benefit .................. — — 21,855 — — — — 21,855
Other stock compensation ........ 30 5 7,333 — — (473) — 6,865
Balances, December 31, 2005 ..... 179,063 $29,843 $1,098,117 $1,538,306 $24,832 $(13,629) $(203,364) $2,474,105
The accompanying notes are an integral part of the consolidated financial statements.
61