Humana 2005 Annual Report Download - page 82
Download and view the complete annual report
Please find page 82 of the 2005 Humana annual report below. You can navigate through the pages in the report by either clicking on the pages listed below, or by using the keyword search tool below to find specific information within the annual report.-
 1
1 -
2
-
3
-
4
-
5
-
6
-
7
-
8
-
9
-
10
-
11
-
12
-
13
-
14
-
15
-
16
-
17
-
18
-
19
-
20
-
21
-
22
-
23
-
24
-
25
-
26
-
27
-
28
-
29
-
30
-
31
-
32
-
33
-
34
-
35
-
36
-
37
-
38
-
39
-
40
-
41
-
42
-
43
-
44
-
45
-
46
-
47
-
48
-
49
-
50
-
51
-
52
-
53
-
54
-
55
-
56
-
57
-
58
-
59
-
60
-
61
-
62
-
63
-
64
-
65
-
66
-
67
-
68
-
69
-
70
-
71
-
 72
72 -
 73
73 -
 74
74 -
 75
75 -
 76
76 -
 77
77 -
 78
78 -
 79
79 -
 80
80 -
 81
81 -
 82
82 -
 83
83 -
 84
84 -
 85
85 -
 86
86 -
 87
87 -
 88
88 -
 89
89 -
 90
90 -
 91
91 -
 92
92 -
93
-
94
-
95
-
96
-
97
-
98
-
99
-
100
-
101
-
102
-
103
-
104
-
105
-
106
-
107
-
108
-
109
-
110
-
111
-
112
-
113
-
114
-
115
-
116
-
117
-
118
-
119
-
120
-
121
-
122
-
123
-
124
-
125
-
126
-
127
-
128
 |
 |

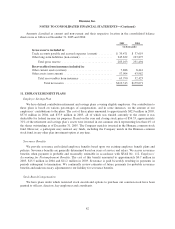
Humana Inc.
NOTES TO CONSOLIDATED FINANCIAL STATEMENTS—(Continued)
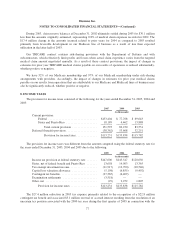
During the first quarter of 2006, we sold CorSolutions Medical, Inc., a disease management venture capital
investment classified as a redeemable preferred stock in the previous table, for cash proceeds of $65.9 million,
resulting in a realized gain of $52.3 million ($32.6 million after tax).
Investment securities classified as long-term assets were as follows at December 31, 2005 and 2004:
2005 2004
Amortized
Cost
Gross
Unrealized
Gains
Gross
Unrealized
Losses
Fair
Value
Amortized
Cost
Gross
Unrealized
Gains
Gross
Unrealized
Losses
Fair
Value
(in thousands)
U.S. Government obligations .......... $174,397 $ 36 $(2,542) $171,891 $146,221 $ 514 $ (901) $145,834
Tax exempt municipal securities ....... 96,875 119 (1,123) 95,871 69,529 686 (271) 69,944
Corporate and other securities ......... 73,562 88 (617) 73,033 69,514 1,077 (143) 70,448
Mortgage-backed securities ........... 11,104 — (206) 10,898 14,258 143 (37) 14,364
Redeemable preferred stocks .......... 14,552 23,728 (49) 38,231 31,348 12,767 (36) 44,079
Debt securities ................. 370,490 23,971 (4,537) 389,924 330,870 15,187 (1,388) 344,669
Non-redeemable preferred stocks ...... — — — — 2,491 24 — 2,515
Common stocks .................... 1,111 — — 1,111 1,281 — — 1,281
Equity securities ................ 1,111 — — 1,111 3,772 24 — 3,796
Long-term investment securities . . . $371,601 $23,971 $(4,537) $391,035 $334,642 $15,211 $(1,388) $348,465
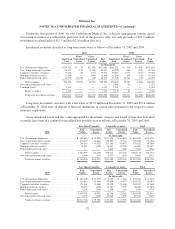
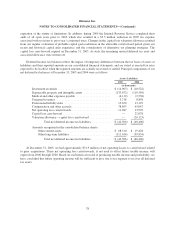
Long-term investment securities with a fair value of $93.5 million at December 31, 2005 and $95.4 million
at December 31, 2004 were on deposit at financial institutions in certain states pursuant to the respective states’
insurance regulations.
Gross unrealized losses and fair value aggregated by investment category and length of time that individual
securities have been in a continuous unrealized loss position were as follows at December 31, 2005 and 2004:
Less than 12 months 12 months or more Total
2005
Fair
Value
Unrealized
Losses
Fair
Value
Unrealized
Losses
Fair
Value
Unrealized
Losses
(in thousands)
U.S. Government obligations ...................... $ 611,683 $ (3,790) $272,176 $ (8,481) $ 883,859 $(12,271)
Tax exempt municipal securities ................... 470,477 (4,846) 258,825 (7,914) 729,302 (12,760)
Corporate and other securities ..................... 248,016 (4,932) 131,166 (4,867) 379,182 (9,799)
Mortgage-backed securities ....................... 51,921 (742) 36,987 (2,225) 88,908 (2,967)
Redeemable preferred stocks ...................... — — 6,862 (338) 6,862 (338)
Debt securities ............................. 1,382,097 (14,310) 706,016 (23,825) 2,088,113 (38,135)
Non-redeemable preferred stocks .................. 4,409 (37) 5,477 (206) 9,886 (243)
Total investment securities .................... $1,386,506 $(14,347) $711,493 $(24,031) $2,097,999 $(38,378)
Less than 12 months 12 months or more Total
2004
Fair
Value
Unrealized
Losses
Fair
Value
Unrealized
Losses
Fair
Value
Unrealized
Losses
(in thousands)
U.S. Government obligations ...................... $ 486,209 $ (3,717) $ 4,351 $ (136) $ 490,560 $ (3,853)
Tax exempt municipal securities ................... 316,913 (3,346) 26,869 (647) 343,782 (3,993)
Corporate and other securities ..................... 171,048 (1,846) 32,719 (1,418) 203,767 (3,264)
Mortgage-backed securities ....................... 28,865 (430) 16,581 (753) 45,446 (1,183)
Redeemable preferred stocks ...................... 6,266 (158) 1,238 (12) 7,504 (170)
Debt securities ............................. 1,009,301 (9,497) 81,758 (2,966) 1,091,059 (12,463)
Non-redeemable preferred stocks .................. 8,455 (240) 10,789 (329) 19,244 (569)
Total investment securities .................... $1,017,756 $ (9,737) $ 92,547 $ (3,295) $1,110,303 $(13,032)
72