Humana 2005 Annual Report Download - page 95
Download and view the complete annual report
Please find page 95 of the 2005 Humana annual report below. You can navigate through the pages in the report by either clicking on the pages listed below, or by using the keyword search tool below to find specific information within the annual report.-
 1
1 -
2
-
3
-
4
-
5
-
6
-
7
-
8
-
9
-
10
-
11
-
12
-
13
-
14
-
15
-
16
-
17
-
18
-
19
-
20
-
21
-
22
-
23
-
24
-
25
-
26
-
27
-
28
-
29
-
30
-
31
-
32
-
33
-
34
-
35
-
36
-
37
-
38
-
39
-
40
-
41
-
42
-
43
-
44
-
45
-
46
-
47
-
48
-
49
-
50
-
51
-
52
-
53
-
54
-
55
-
56
-
57
-
58
-
59
-
60
-
61
-
62
-
63
-
64
-
65
-
66
-
67
-
68
-
69
-
70
-
71
-
72
-
73
-
74
-
75
-
76
-
77
-
78
-
79
-
80
-
81
-
82
-
83
-
84
-
 85
85 -
 86
86 -
 87
87 -
 88
88 -
 89
89 -
 90
90 -
 91
91 -
 92
92 -
 93
93 -
 94
94 -
 95
95 -
 96
96 -
 97
97 -
 98
98 -
 99
99 -
 100
100 -
 101
101 -
 102
102 -
 103
103 -
 104
104 -
 105
105 -
106
-
107
-
108
-
109
-
110
-
111
-
112
-
113
-
114
-
115
-
116
-
117
-
118
-
119
-
120
-
121
-
122
-
123
-
124
-
125
-
126
-
127
-
128
 |
 |

Humana Inc.
NOTES TO CONSOLIDATED FINANCIAL STATEMENTS—(Continued)
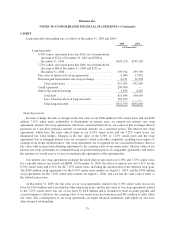
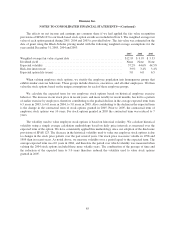
The effects on net income and earnings per common share if we had applied the fair value recognition
provisions of SFAS 123 to our fixed-based stock option awards are included in Note 2. The weighted average fair
value of each option granted during 2005, 2004 and 2003 is provided below. The fair value was estimated on the
date of grant using the Black-Scholes pricing model with the following weighted average assumptions for the
years ended December 31, 2005, 2004 and 2003:
2005 2004 2003
Weighted average fair value at grant date ................................... $12.93 $ 9.95 $ 5.33
Dividend yield ......................................................... None None None
Expected volatility ..................................................... 37.2% 44.6% 44.5%
Risk-free interest rate ................................................... 3.9% 3.4% 3.4%
Expected option life (years) .............................................. 5.0 6.0 6.5
When valuing employee stock options, we stratify the employee population into homogenous groups that
exhibit similar exercise behaviors. These groups include directors, executives, and all other employees. We then
value the stock options based on the unique assumptions for each of these employee groups.
We calculate the expected term for our employee stock options based on historical employee exercise
behavior. The increase in our stock price in recent years, and more notably in recent months, has led to a pattern
of earlier exercise by employees, therefore contributing to the gradual decline in the average expected term from
6.5 years in 2003, to 6.0 years in 2004, to 5.0 years in 2005. Also contributing to the decline in the expected term
is the change in the contractual term of stock options granted in 2005. Prior to 2005, the contractual term of
employee stock options was 10 years. For stock options granted in 2005 the contractual term was reduced to 7
years.
The volatility used to value employee stock options is based on historical volatility. We calculate historical
volatility using a simple average calculation methodology based on daily price intervals as measured over the
expected term of the option. We have consistently applied this methodology since our adoption of the disclosure
provisions of SFAS 123. The decrease in the historical volatility used to value our employee stock options is due
to changes in the stock price pattern over the past several years. Our stock price was more volatile in 1998 and
1999 than in recent years. As noted above, we measure volatility over a period equal to the expected term. The
average expected term was 6.0 years in 2004, and therefore the period over which volatility was measured when
valuing the 2004 stock options included these more volatile years. The combination of the passage of time and
the reduction of the expected term to 5.0 years therefore reduced the volatility used to value stock options
granted in 2005.
85