Humana 2005 Annual Report Download - page 102
Download and view the complete annual report
Please find page 102 of the 2005 Humana annual report below. You can navigate through the pages in the report by either clicking on the pages listed below, or by using the keyword search tool below to find specific information within the annual report.-
 1
1 -
2
-
3
-
4
-
5
-
6
-
7
-
8
-
9
-
10
-
11
-
12
-
13
-
14
-
15
-
16
-
17
-
18
-
19
-
20
-
21
-
22
-
23
-
24
-
25
-
26
-
27
-
28
-
29
-
30
-
31
-
32
-
33
-
34
-
35
-
36
-
37
-
38
-
39
-
40
-
41
-
42
-
43
-
44
-
45
-
46
-
47
-
48
-
49
-
50
-
51
-
52
-
53
-
54
-
55
-
56
-
57
-
58
-
59
-
60
-
61
-
62
-
63
-
64
-
65
-
66
-
67
-
68
-
69
-
70
-
71
-
72
-
73
-
74
-
75
-
76
-
77
-
78
-
79
-
80
-
81
-
82
-
83
-
84
-
85
-
86
-
87
-
88
-
89
-
90
-
91
-
 92
92 -
 93
93 -
 94
94 -
 95
95 -
 96
96 -
 97
97 -
 98
98 -
 99
99 -
 100
100 -
 101
101 -
 102
102 -
 103
103 -
 104
104 -
 105
105 -
 106
106 -
 107
107 -
 108
108 -
 109
109 -
 110
110 -
 111
111 -
 112
112 -
113
-
114
-
115
-
116
-
117
-
118
-
119
-
120
-
121
-
122
-
123
-
124
-
125
-
126
-
127
-
128
 |
 |

Humana Inc.
NOTES TO CONSOLIDATED FINANCIAL STATEMENTS—(Continued)
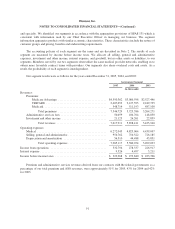
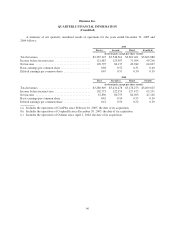
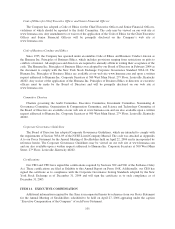
Commercial Segment
2005 2004 2003
(in thousands)
Revenues:
Premiums:
Fully insured:
PPO .......................................... $3,635,347 $3,786,501 $3,369,109
HMO ......................................... 2,432,768 2,827,981 2,871,697
Total fully insured ........................... 6,068,115 6,614,482 6,240,806
Specialty .......................................... 386,747 349,564 320,206
Total premiums ............................. 6,454,862 6,964,046 6,561,012
Administrative services fees ............................... 209,378 166,032 122,846
Investment and other income .............................. 135,976 115,836 106,513
Total revenues .............................. 6,800,216 7,245,914 6,790,371
Operating expenses:
Medical ............................................... 5,379,425 5,844,583 5,440,414
Selling, general and administrative .......................... 1,220,008 1,167,342 1,131,843
Depreciation and amortization ............................. 72,548 73,304 82,948
Total operating expenses ...................... 6,671,981 7,085,229 6,655,205
Income from operations ...................................... 128,235 160,685 135,166
Interest expense ............................................. 29,789 18,675 14,156
Income before income taxes ................................... $ 98,446 $ 142,010 $ 121,010
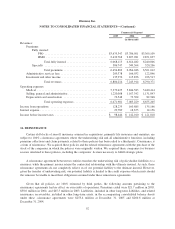
16. REINSURANCE
Certain old blocks of run-off insurance assumed in acquisitions, primarily life insurance and annuities, are
subject to 100% coinsurance agreements where the underwriting risk and all administrative functions, including
premium collections and claim payments, related to these policies has been ceded to a third-party. Coinsurance is
a form of reinsurance. We acquired these policies and the related reinsurance agreements with the purchase of the
stock of the companies in which the policies were originally written. We acquired these companies for business
reasons unrelated to these policies, including the companies’ licenses necessary to fulfill strategic plans.
A reinsurance agreement between two entities transfers the underwriting risk of policyholder liabilities to a
reinsurer; while the primary insurer retains the contractual relationship with the ultimate insured. As such, these
reinsurance agreements do not completely relieve us of our potential liability to the ultimate insured. However,
given the transfer of underwriting risk, our potential liability is limited to the credit exposure which exists should
the reinsurer be unable to meet their obligations assumed under these reinsurance agreements.
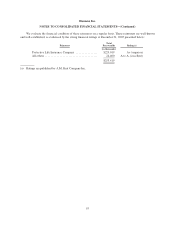
Given that all policies are 100% reinsured by third parties, the following amounts pertaining to the
reinsurance agreements had no effect on our results of operations. Premiums ceded were $21.7 million in 2005,
$30.0 million in 2004, and $45.3 million in 2003. Liabilities, included in other long-term liabilities, and related
reinsurance recoverables, included in other long-term assets, in the accompanying consolidated balance sheets
under these coinsurance agreements were $253.4 million at December 31, 2005 and $260.6 million at
December 31, 2004.
92