Humana 2005 Annual Report Download - page 68
Download and view the complete annual report
Please find page 68 of the 2005 Humana annual report below. You can navigate through the pages in the report by either clicking on the pages listed below, or by using the keyword search tool below to find specific information within the annual report.-
 1
1 -
2
-
3
-
4
-
5
-
6
-
7
-
8
-
9
-
10
-
11
-
12
-
13
-
14
-
15
-
16
-
17
-
18
-
19
-
20
-
21
-
22
-
23
-
24
-
25
-
26
-
27
-
28
-
29
-
30
-
31
-
32
-
33
-
34
-
35
-
36
-
37
-
38
-
39
-
40
-
41
-
42
-
43
-
44
-
45
-
46
-
47
-
48
-
49
-
50
-
51
-
52
-
53
-
54
-
55
-
56
-
57
-
 58
58 -
 59
59 -
 60
60 -
 61
61 -
 62
62 -
 63
63 -
 64
64 -
 65
65 -
 66
66 -
 67
67 -
 68
68 -
 69
69 -
 70
70 -
 71
71 -
 72
72 -
 73
73 -
 74
74 -
 75
75 -
 76
76 -
 77
77 -
 78
78 -
79
-
80
-
81
-
82
-
83
-
84
-
85
-
86
-
87
-
88
-
89
-
90
-
91
-
92
-
93
-
94
-
95
-
96
-
97
-
98
-
99
-
100
-
101
-
102
-
103
-
104
-
105
-
106
-
107
-
108
-
109
-
110
-
111
-
112
-
113
-
114
-
115
-
116
-
117
-
118
-
119
-
120
-
121
-
122
-
123
-
124
-
125
-
126
-
127
-
128
 |
 |

three reporting units consist of Medicare Advantage, TRICARE and Medicaid. Goodwill is assigned to the
reporting unit that is expected to benefit from a specific acquisition.
Our strategy, long-range business plan, and annual planning process support our goodwill impairment tests.
These tests are based primarily on an evaluation of future discounted cash flows under several scenarios. We
used a range of discount rates that correspond to our weighted-average cost of capital. Key assumptions including
changes in membership, premium yields, medical cost trends and certain government contract extensions are
consistent with those utilized in our long-range business plan and annual planning process. If these assumptions
differ from actual, the estimates underlying our goodwill impairment tests could be adversely affected. Goodwill
impairment tests completed in each of the last three years did not result in an impairment loss.
Long-lived assets consist of property and equipment and other finite-lived intangible assets. These assets are
depreciated or amortized over their estimated useful life, and are subject to impairment reviews. We periodically
review long-lived assets whenever adverse events or changes in circumstances indicate the carrying value of the
asset may not be recoverable. In assessing recoverability, we must make assumptions regarding estimated future
cash flows and other factors to determine if an impairment loss may exist, and, if so, estimate fair value. We also
must estimate and make assumptions regarding the useful life we assign to our long-lived assets. If these
estimates or their related assumptions change in the future, we may be required to record impairment losses or
change the useful life, including accelerating depreciation for these assets. There were no impairment losses in
2005. We recognized losses due to impairment and accelerated depreciation from changes in estimated useful life
of $9.3 million in 2004 and $30.8 million in 2003. See Note 5 to the consolidated financial statements included in
Item 8.—Financial Statements and Supplementary Data.
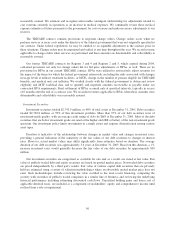
ITEM 7A. QUANTITATIVE AND QUALITATIVE DISCLOSURES ABOUT MARKET RISK
The level of our pretax earnings is subject to market risk due to changes in investment income from our
fixed income portfolio which is partially offset by both our debt position and the short-term duration of the fixed
income investment portfolio.
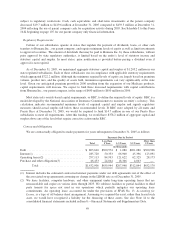
We evaluated the impact on our investment income and debt expense resulting from a hypothetical change
in interest rates of 100, 200 and 300 basis points over the next twelve-month period, as reflected in the following
table. The evaluation was based on our fixed income portfolio and our debt position as of December 31, 2005 and
2004. The modeling technique used to calculate the pro forma net change in pretax earnings considered the cash
flows related to fixed income investments and debt, which are subject to interest rate changes during a
prospective twelve-month period. This evaluation measures parallel shifts in interest rates and may not account
for certain unpredictable events that may effect interest income, including, among others, unexpected changes of
cash flow into and out of the portfolio, shifts in the asset mix between taxable and tax-exempt securities, and
spread changes specific to various investment categories. In the past ten years, changes in 3 month LIBOR rates
during the year have exceeded 300 basis points twice, have not changed between 200 and 300 basis points, have
changed between 100 and 200 basis points once and have changed by less than 100 basis points seven times.
LIBOR was 4.54% at December 31, 2005.
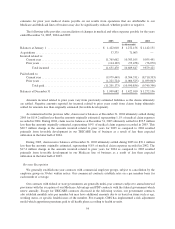
Increase (decrease) in
pretax earnings given an
interest rate decrease of
X basis points
Increase (decrease) in
pretax earnings given an
interest rate increase of
X basis points
(300) (200) (100) 100 200 300
(in thousands)
As of December 31, 2005
Fixed income portfolio .......................... $(54,167) $(35,833) $(17,331) $ 17,375 $ 34,661 $ 52,924
Debt......................................... 33,842 22,561 11,281 (11,281) (22,561) (33,842)
Total .................................... $(20,325) $(13,272) $ (6,050) $ 6,094 $ 12,100 $ 19,082
As of December 31, 2004
Fixed income portfolio .......................... $(20,530) $(18,258) $ (8,974) $ 9,212 $ 18,439 $ 27,299
Debt......................................... 14,200 14,200 7,100 (7,100) (14,200) (21,300)
Total .................................... $ (6,330) $ (4,058) $ (1,874) $ 2,112 $ 4,239 $ 5,999
58