Humana 2005 Annual Report Download - page 22
Download and view the complete annual report
Please find page 22 of the 2005 Humana annual report below. You can navigate through the pages in the report by either clicking on the pages listed below, or by using the keyword search tool below to find specific information within the annual report.-
 1
1 -
2
-
3
-
4
-
5
-
6
-
7
-
8
-
9
-
10
-
11
-
 12
12 -
 13
13 -
 14
14 -
 15
15 -
 16
16 -
 17
17 -
 18
18 -
 19
19 -
 20
20 -
 21
21 -
 22
22 -
 23
23 -
 24
24 -
 25
25 -
 26
26 -
 27
27 -
 28
28 -
 29
29 -
 30
30 -
 31
31 -
 32
32 -
33
-
34
-
35
-
36
-
37
-
38
-
39
-
40
-
41
-
42
-
43
-
44
-
45
-
46
-
47
-
48
-
49
-
50
-
51
-
52
-
53
-
54
-
55
-
56
-
57
-
58
-
59
-
60
-
61
-
62
-
63
-
64
-
65
-
66
-
67
-
68
-
69
-
70
-
71
-
72
-
73
-
74
-
75
-
76
-
77
-
78
-
79
-
80
-
81
-
82
-
83
-
84
-
85
-
86
-
87
-
88
-
89
-
90
-
91
-
92
-
93
-
94
-
95
-
96
-
97
-
98
-
99
-
100
-
101
-
102
-
103
-
104
-
105
-
106
-
107
-
108
-
109
-
110
-
111
-
112
-
113
-
114
-
115
-
116
-
117
-
118
-
119
-
120
-
121
-
122
-
123
-
124
-
125
-
126
-
127
-
128
 |
 |

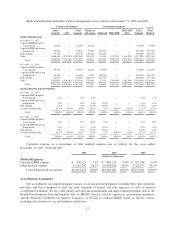
Medical membership under these various arrangements was as follows at December 31, 2005 and 2004:
Commercial Segment Government Segment Consol.
Total
Medical
Fully
Insured ASO
Total
Segment
Medicare
Advantage Medicaid TRICARE
TRICARE
ASO
Total
Segment
Medical Membership:
December 31, 2005
Capitated HMO hospital
system based ........... 42,600 — 42,600 35,200 — — — 35,200 77,800
Capitated HMO physician
group based ............ 39,500 — 39,500 23,300 170,400 — — 193,700 233,200
Risk-sharing .............. 49,700 — 49,700 230,200 274,200 — — 504,400 554,100
Other ................... 1,868,000 1,171,000 3,039,000 269,100 13,300 1,750,900 1,138,200 3,171,500 6,210,500
Total ................ 1,999,800 1,171,000 3,170,800 557,800 457,900 1,750,900 1,138,200 3,904,800 7,075,600
December 31, 2004
Capitated HMO hospital
system based ........... 70,300 — 70,300 38,400 17,400 — — 55,800 126,100
Capitated HMO physician
group based ............ 56,300 — 56,300 4,200 188,200 — — 192,400 248,700
Risk-sharing .............. 68,000 — 68,000 208,300 240,700 — — 449,000 517,000
Other ................... 2,091,900 1,018,600 3,110,500 126,300 32,300 1,789,400 1,082,400 3,030,400 6,140,900
Total ................ 2,286,500 1,018,600 3,305,100 377,200 478,600 1,789,400 1,082,400 3,727,600 7,032,700
Medical Membership Distribution:
December 31, 2005
Capitated HMO hospital
system based ........... 2.1% — 1.3% 6.3% — — — 0.9% 1.1%
Capitated HMO physician
group based ............ 2.0% — 1.2% 4.2% 37.2% — — 5.0% 3.3%
Risk-sharing .............. 2.5% — 1.6% 41.3% 59.9% — — 12.9% 7.8%
All other membership ...... 93.4% 100.0% 95.9% 48.2% 2.9% 100.0% 100.0% 81.2% 87.8%
Total ................ 100.0% 100.0% 100.0% 100.0% 100.0% 100.0% 100.0% 100.0% 100.0%
December 31, 2004
Capitated HMO hospital
system based ........... 3.1% — 2.1% 10.2% 3.6% — — 1.5% 1.8%
Capitated HMO physician
group based ............ 2.5% — 1.7% 1.1% 39.3% — — 5.2% 3.5%
Risk-sharing .............. 3.0% — 2.1% 55.2% 50.4% — — 12.0% 7.4%
All other membership ...... 91.4% 100.0% 94.1% 33.5% 6.7% 100.0% 100.0% 81.3% 87.3%
Total ................ 100.0% 100.0% 100.0% 100.0% 100.0% 100.0% 100.0% 100.0% 100.0%
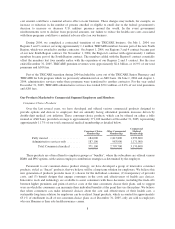
Capitation expense as a percentage of total medical expense was as follows for the years ended
December 31, 2005, 2004 and 2003:
2005 2004 2003
(dollars in thousands)
Medical Expenses:
Capitated HMO expense ............ $ 456,123 3.9% $ 465,231 4.4% $ 597,244 6.0%
Other medical expense ............. 11,195,347 96.1% 10,204,416 95.6% 9,282,177 94.0%
Consolidated medical expense . . . $11,651,470 100.0% $10,669,647 100.0% $9,879,421 100.0%
Accreditation Assessment
Our accreditation assessment program consists of several internal programs, including those that credential
providers and those designed to meet the audit standards of federal and state agencies, as well as external
accreditation standards. We also offer quality and outcome measurement and improvement programs such as the
Health Plan Employer Data Information Sets, or HEDIS, which is used by employers, government purchasers
and the National Committee for Quality Assurance, or NCQA, to evaluate HMOs based on various criteria,
including effectiveness of care and member satisfaction.
12