Humana 2005 Annual Report Download - page 52
Download and view the complete annual report
Please find page 52 of the 2005 Humana annual report below. You can navigate through the pages in the report by either clicking on the pages listed below, or by using the keyword search tool below to find specific information within the annual report.-
 1
1 -
2
-
3
-
4
-
5
-
6
-
7
-
8
-
9
-
10
-
11
-
12
-
13
-
14
-
15
-
16
-
17
-
18
-
19
-
20
-
21
-
22
-
23
-
24
-
25
-
26
-
27
-
28
-
29
-
30
-
31
-
32
-
33
-
34
-
35
-
36
-
37
-
38
-
39
-
40
-
41
-
 42
42 -
 43
43 -
 44
44 -
 45
45 -
 46
46 -
 47
47 -
 48
48 -
 49
49 -
 50
50 -
 51
51 -
 52
52 -
 53
53 -
 54
54 -
 55
55 -
 56
56 -
 57
57 -
 58
58 -
 59
59 -
 60
60 -
 61
61 -
 62
62 -
63
-
64
-
65
-
66
-
67
-
68
-
69
-
70
-
71
-
72
-
73
-
74
-
75
-
76
-
77
-
78
-
79
-
80
-
81
-
82
-
83
-
84
-
85
-
86
-
87
-
88
-
89
-
90
-
91
-
92
-
93
-
94
-
95
-
96
-
97
-
98
-
99
-
100
-
101
-
102
-
103
-
104
-
105
-
106
-
107
-
108
-
109
-
110
-
111
-
112
-
113
-
114
-
115
-
116
-
117
-
118
-
119
-
120
-
121
-
122
-
123
-
124
-
125
-
126
-
127
-
128
 |
 |
giving effect to the addition of 152,600 members from the acquisition of Ochsner. Without giving effect to the
Ochsner acquisition, the decrease was primarily due to the lapse of certain under-performing large group
accounts totaling approximately 94,000 members in 2004 and continued attrition due to the ongoing competitive
environment within the small to mid-market group fully insured accounts, partially offset by membership gains
in the Individual product lines.
Administrative Services Fees
Our administrative services fees for 2004 were $272.8 million, an increase of $1.1 million, or 0.4%, from
$271.7 million for 2003. This increase resulted primarily from higher Commercial ASO membership partially
offset by lower fees related to TRICARE’s change in government-contracted services as described below.
Administrative services fees for the Government segment decreased $42.1 million, or 28.3%, from $148.8
million for 2003 to $106.8 million for 2004. This decline resulted from the transition to the new South Region
contract which carved out certain government programs including the administration of pharmacy and medical
benefits to senior members over the age of 65. We transitioned services under these separate programs to other
providers during 2004.
For the Commercial segment, administrative services fees increased $43.2 million, or 35.2%, from $122.8
million for 2003 to $166.0 million for 2004. This increase resulted from a higher level of ASO membership at
December 31, 2004, which was 1,018,600 members, compared to 712,400 members at December 31, 2003, an
increase of 43%.
Investment and Other Income
Investment and other income totaled $142.1 million in 2004, an increase of $12.7 million from $129.4
million in 2003. This increase primarily resulted from an increase in the average invested balance partially offset
by a decrease in net realized capital gains of approximately $8.4 million. The investment of cash flows from
operations contributed to the increase in the average invested balance and added approximately $18.8 million to
interest income. The average yield on investment securities was 3.6% in 2004 compared to 3.5% in 2003.
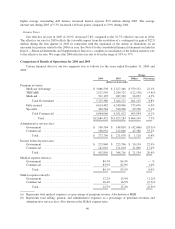
Medical Expense
Consolidated medical expenses increased $790.2 million, or 8.0%, to $10.7 billion in 2004 from $9.9 billion
in 2003. The increase was primarily driven by the Ochsner acquisition and an increase in average per member
claims costs primarily from the effects of health care inflation.
The consolidated MER for 2004 was 84.1%, increasing 60 basis points from 83.5% for 2003 primarily due
to the increase in the MER for the Commercial segment.
The Government segment’s medical expenses increased $386.1 million, or 8.7%, during 2004 primarily due
to the increase in the number of Medicare members, including those related to the Ochsner acquisition, and the
increase in average per member claims costs, partially offset by lower medical expenses associated with
transitioning to the TRICARE South contract.
The Government segment’s MER for 2004 was 84.3%, which was flat when compared to 2003. The
Medicare Advantage premium increases were consistent with medical cost increases for 2004 reflecting our
efforts of adjusting benefit levels commensurate with reimbursement rates.
The Commercial segment’s medical expenses increased $404.2 million, or 7.4%, during 2004. The increase
was primarily driven by an increase in average per member claims costs primarily from the effects of health care
inflation. The increase in average per member claims costs for fully insured group members was approximately
8% to 10% for 2004.
42