Humana 2005 Annual Report Download - page 51
Download and view the complete annual report
Please find page 51 of the 2005 Humana annual report below. You can navigate through the pages in the report by either clicking on the pages listed below, or by using the keyword search tool below to find specific information within the annual report.-
 1
1 -
2
-
3
-
4
-
5
-
6
-
7
-
8
-
9
-
10
-
11
-
12
-
13
-
14
-
15
-
16
-
17
-
18
-
19
-
20
-
21
-
22
-
23
-
24
-
25
-
26
-
27
-
28
-
29
-
30
-
31
-
32
-
33
-
34
-
35
-
36
-
37
-
38
-
39
-
40
-
 41
41 -
 42
42 -
 43
43 -
 44
44 -
 45
45 -
 46
46 -
 47
47 -
 48
48 -
 49
49 -
 50
50 -
 51
51 -
 52
52 -
 53
53 -
 54
54 -
 55
55 -
 56
56 -
 57
57 -
 58
58 -
 59
59 -
 60
60 -
 61
61 -
62
-
63
-
64
-
65
-
66
-
67
-
68
-
69
-
70
-
71
-
72
-
73
-
74
-
75
-
76
-
77
-
78
-
79
-
80
-
81
-
82
-
83
-
84
-
85
-
86
-
87
-
88
-
89
-
90
-
91
-
92
-
93
-
94
-
95
-
96
-
97
-
98
-
99
-
100
-
101
-
102
-
103
-
104
-
105
-
106
-
107
-
108
-
109
-
110
-
111
-
112
-
113
-
114
-
115
-
116
-
117
-
118
-
119
-
120
-
121
-
122
-
123
-
124
-
125
-
126
-
127
-
128
 |
 |

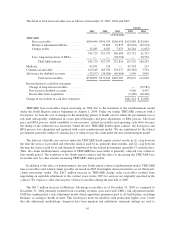
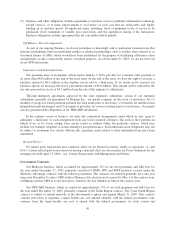
Medical membership was as follows at December 31, 2004 and 2003:
Change
2004 2003 Members Percentage
Government segment medical members:
Medicare Advantage ................................ 377,200 328,600 48,600 14.8%
Medicaid ......................................... 478,600 468,900 9,700 2.1%
TRICARE ........................................ 1,789,400 1,849,700 (60,300) (3.3)%
TRICARE ASO .................................... 1,082,400 1,057,200 25,200 2.4%
Total Government .............................. 3,727,600 3,704,400 23,200 0.6%
Commercial segment medical members:
Fully insured ...................................... 2,286,500 2,352,800 (66,300) (2.8)%
ASO............................................. 1,018,600 712,400 306,200 43.0%
Total Commercial .............................. 3,305,100 3,065,200 239,900 7.8%
Total medical membership ............................... 7,032,700 6,769,600 263,100 3.9%
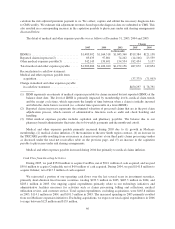
This table of financial data should be reviewed in connection with the discussion on the following pages.
Summary
Net income was $280.0 million, or $1.72 per diluted common share, in 2004 compared to $228.9 million, or
$1.41 per diluted common share, in 2003. The increase in net income consisted of improved profits in both of our
business segments, driven by higher earnings from our Medicare and commercial products. The 2003 results
included expenses for asset impairments as more fully described in Note 5 to the consolidated financial
statements included in Item 8.—Financial Statements and Supplementary Data.
Premium Revenues and Medical Membership
Premium revenues increased 7.3% to $12.7 billion for 2004, compared to $11.8 billion for 2003. Higher
premium revenues resulted primarily from the Ochsner acquisition, as more fully described in Note 3 to the
consolidated financial statements included in Item 8.—Financial Statements and Supplementary Data, and an
increase in Medicare Advantage and fully insured commercial average per member premiums. Items impacting
average per member premiums include changes in premium rates as well as changes in the geographic mix of
membership, the mix of product offerings, and the mix of benefit plans selected by our membership.
Government segment premium revenues increased 8.8% to $5.7 billion for 2004, compared to $5.3 billion
for 2003. This increase primarily was attributable to our Medicare Advantage operations. Medicare Advantage
membership was 377,200 at December 31, 2004, compared to 328,600 at December 31, 2003, an increase of
48,600 members, or 14.8%, including 33,100 members added through the acquisition of Ochsner. Average per
member premiums for our Medicare Advantage business increased approximately 10% for 2004, reflecting
higher reimbursement from CMS. TRICARE premium revenues decreased 5.4% in 2004 reflecting the transition
to the new South Region contract which included a temporary loss of approximately 1 million members for 4
months in 2004.
Commercial segment premium revenues increased 6.1% to $7.0 billion for 2004, compared to $6.5 billion
for 2003. This increase resulted from the Ochsner acquisition and increases in average per member premiums in
the 6% to 8% range on our fully insured commercial business partially offset by membership attrition. Average
per member premium increases of 6% to 8% include the impact of an increasing mix of individual products into
our fully insured membership. A lower premium corresponding to lower benefits on products sold to individuals
reduced our average per member premium trend by approximately 150 to 200 basis points. Our fully insured
commercial medical membership decreased 2.8%, or 66,300 members, to 2,286,500 at December 31, 2004 after
41