Humana 2005 Annual Report Download - page 94
Download and view the complete annual report
Please find page 94 of the 2005 Humana annual report below. You can navigate through the pages in the report by either clicking on the pages listed below, or by using the keyword search tool below to find specific information within the annual report.-
 1
1 -
2
-
3
-
4
-
5
-
6
-
7
-
8
-
9
-
10
-
11
-
12
-
13
-
14
-
15
-
16
-
17
-
18
-
19
-
20
-
21
-
22
-
23
-
24
-
25
-
26
-
27
-
28
-
29
-
30
-
31
-
32
-
33
-
34
-
35
-
36
-
37
-
38
-
39
-
40
-
41
-
42
-
43
-
44
-
45
-
46
-
47
-
48
-
49
-
50
-
51
-
52
-
53
-
54
-
55
-
56
-
57
-
58
-
59
-
60
-
61
-
62
-
63
-
64
-
65
-
66
-
67
-
68
-
69
-
70
-
71
-
72
-
73
-
74
-
75
-
76
-
77
-
78
-
79
-
80
-
81
-
82
-
83
-
 84
84 -
 85
85 -
 86
86 -
 87
87 -
 88
88 -
 89
89 -
 90
90 -
 91
91 -
 92
92 -
 93
93 -
 94
94 -
 95
95 -
 96
96 -
 97
97 -
 98
98 -
 99
99 -
 100
100 -
 101
101 -
 102
102 -
 103
103 -
 104
104 -
105
-
106
-
107
-
108
-
109
-
110
-
111
-
112
-
113
-
114
-
115
-
116
-
117
-
118
-
119
-
120
-
121
-
122
-
123
-
124
-
125
-
126
-
127
-
128
 |
 |

Humana Inc.
NOTES TO CONSOLIDATED FINANCIAL STATEMENTS—(Continued)
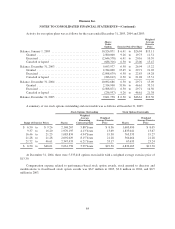
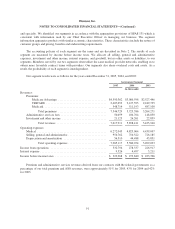
Activity for our option plans was as follows for the years ended December 31, 2005, 2004 and 2003:
Shares
Under
Option Exercise Price Per Share
Weighted
Average
Exercise
Price
Balance, January 1, 2003 ................................ 10,526,871 $ 6.41 to $26.94 $13.11
Granted .......................................... 2,500,000 9.26 to 19.73 11.51
Exercised ......................................... (2,646,578) 6.41 to 20.16 10.59
Canceled or lapsed ................................. (686,316) 6.50 to 23.06 15.47
Balance, December 31, 2003 ............................. 9,693,977 6.50 to 26.94 13.22
Granted .......................................... 2,784,000 15.45 to 29.71 21.03
Exercised ......................................... (2,098,679) 6.50 to 22.63 14.28
Canceled or lapsed ................................. (286,612) 6.50 to 21.28 15.51
Balance, December 31, 2004 ............................. 10,092,686 6.50 to 29.71 15.09
Granted .......................................... 2,314,900 31.96 to 46.61 33.51
Exercised ......................................... (2,508,871) 6.50 to 29.71 14.50
Canceled or lapsed ................................. (236,957) 9.26 to 46.61 21.38
Balance, December 31, 2005 ............................. 9,661,758 $ 6.50 to $46.61 $19.50
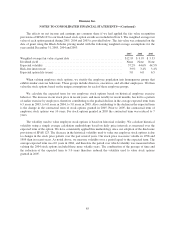
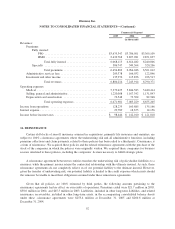
A summary of our stock options outstanding and exercisable was as follows at December 31, 2005:
Stock Options Outstanding Stock Options Exercisable
Range of Exercise Prices Shares
Weighted
Average
Remaining
Contractual Life
Weighted
Average Exercise
Price Shares
Weighted
Average Exercise
Price
$ 6.50 to $ 9.26 2,168,267 5.88 Years $ 8.36 1,603,490 $ 8.05
9.37 to 16.20 1,970,195 4.13 Years 13.69 1,835,041 13.67
16.46 to 21.25 1,083,834 4.94 Years 19.30 763,535 19.27
21.28 to 21.28 2,092,029 8.15 Years 21.28 560,464 21.28
21.72 to 46.61 2,347,433 6.21 Years 33.17 67,635 23.24
$ 6.50 to $46.61 9,661,758 5.99 Years $19.50 4,830,165 $13.70
At December 31, 2004, there were 5,335,418 options exercisable with a weighted average exercise price of
$13.30.
Compensation expense related to performance-based stock option awards, stock granted to directors and
modifications to fixed-based stock option awards was $6.9 million in 2005, $3.8 million in 2004, and $0.5
million in 2003.
84