Humana 2005 Annual Report Download - page 54
Download and view the complete annual report
Please find page 54 of the 2005 Humana annual report below. You can navigate through the pages in the report by either clicking on the pages listed below, or by using the keyword search tool below to find specific information within the annual report.-
 1
1 -
2
-
3
-
4
-
5
-
6
-
7
-
8
-
9
-
10
-
11
-
12
-
13
-
14
-
15
-
16
-
17
-
18
-
19
-
20
-
21
-
22
-
23
-
24
-
25
-
26
-
27
-
28
-
29
-
30
-
31
-
32
-
33
-
34
-
35
-
36
-
37
-
38
-
39
-
40
-
41
-
42
-
43
-
 44
44 -
 45
45 -
 46
46 -
 47
47 -
 48
48 -
 49
49 -
 50
50 -
 51
51 -
 52
52 -
 53
53 -
 54
54 -
 55
55 -
 56
56 -
 57
57 -
 58
58 -
 59
59 -
 60
60 -
 61
61 -
 62
62 -
 63
63 -
 64
64 -
65
-
66
-
67
-
68
-
69
-
70
-
71
-
72
-
73
-
74
-
75
-
76
-
77
-
78
-
79
-
80
-
81
-
82
-
83
-
84
-
85
-
86
-
87
-
88
-
89
-
90
-
91
-
92
-
93
-
94
-
95
-
96
-
97
-
98
-
99
-
100
-
101
-
102
-
103
-
104
-
105
-
106
-
107
-
108
-
109
-
110
-
111
-
112
-
113
-
114
-
115
-
116
-
117
-
118
-
119
-
120
-
121
-
122
-
123
-
124
-
125
-
126
-
127
-
128
 |
 |

Liquidity
Our primary sources of cash include receipts of premiums, administrative services fees, investment income,
as well as proceeds from the sale or maturity of our investment securities and from borrowings. Our primary uses
of cash include disbursements for claims payments, SG&A expenses, interest expense, taxes, purchases of
investment securities, capital expenditures, acquisitions, and payments on borrowings. Because premiums
generally are collected in advance of claim payments by a period of up to several months in many instances, our
business should normally produce positive cash flows during a period of increasing enrollment. Conversely, cash
flows would be negatively impacted during a period of shrinking enrollment. We have recently been
experiencing improving operating cash flows associated with growth in Medicare enrollment.
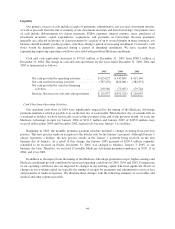
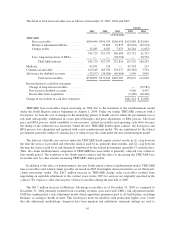
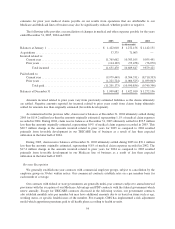
Cash and cash equivalents increased to $732.0 million at December 31, 2005 from $580.1 million at
December 31, 2004. The change in cash and cash equivalents for the years ended December 31, 2005, 2004 and
2003 is summarized as follows:
2005 2004 2003
(in thousands)
Net cash provided by operating activities ........ $625,627 $ 347,809 $ 413,140
Net cash used in investing activities ............ (767,276) (624,081) (382,837)
Net cash provided by (used in) financing
activities ................................ 293,586 (75,053) 179,744
Increase (decrease) in cash and cash equivalents . . . $ 151,937 $(351,325) $ 210,047
Cash Flow from Operating Activities
Our operating cash flows in 2004 were significantly impacted by the timing of the Medicare Advantage
premium remittance which is payable to us on the first day of each month. When the first day of a month falls on
a weekend or holiday, we have historically received this payment at the end of the previous month. As such, the
Medicare Advantage receipts for January 2004 of $211.9 million and January 2003 of $205.8 million were
received in December 2003 and December 2002, respectively, because January 1 is a holiday.
Beginning in 2005, the monthly premium payment schedule included a change in timing from previous
practice. This new practice made an exception to the holiday rule for the January 1 payment. Although January 1
always represents a holiday, the new practice results in the January 1 payment being received on the first
business day of January. As a result of this change, the January 2005 payment of $290.3 million originally
scheduled to be received on Friday, December 31, 2004, was changed to Monday, January 3, 2005, or one
business day later. Therefore, we received 12 monthly Medicare Advantage premium remittances in 2005, 11 in
2004, and 12 in 2003.
In addition to the impact from the timing of the Medicare Advantage premium receipts, higher earnings and
Medicare enrollment growth contributed to increased operating cash flows in 2005, 2004 and 2003. Comparisons
of our operating cash flows also are impacted by changes in our working capital. The most significant drivers of
changes in our working capital are typically the timing of receipts for premiums and administrative services fees
and payments of medical expenses. We illustrate these changes with the following summary of receivables and
medical and other expenses payable.
44