Humana 2005 Annual Report Download - page 91
Download and view the complete annual report
Please find page 91 of the 2005 Humana annual report below. You can navigate through the pages in the report by either clicking on the pages listed below, or by using the keyword search tool below to find specific information within the annual report.-
 1
1 -
2
-
3
-
4
-
5
-
6
-
7
-
8
-
9
-
10
-
11
-
12
-
13
-
14
-
15
-
16
-
17
-
18
-
19
-
20
-
21
-
22
-
23
-
24
-
25
-
26
-
27
-
28
-
29
-
30
-
31
-
32
-
33
-
34
-
35
-
36
-
37
-
38
-
39
-
40
-
41
-
42
-
43
-
44
-
45
-
46
-
47
-
48
-
49
-
50
-
51
-
52
-
53
-
54
-
55
-
56
-
57
-
58
-
59
-
60
-
61
-
62
-
63
-
64
-
65
-
66
-
67
-
68
-
69
-
70
-
71
-
72
-
73
-
74
-
75
-
76
-
77
-
78
-
79
-
80
-
 81
81 -
 82
82 -
 83
83 -
 84
84 -
 85
85 -
 86
86 -
 87
87 -
 88
88 -
 89
89 -
 90
90 -
 91
91 -
 92
92 -
 93
93 -
 94
94 -
 95
95 -
 96
96 -
 97
97 -
 98
98 -
 99
99 -
 100
100 -
 101
101 -
102
-
103
-
104
-
105
-
106
-
107
-
108
-
109
-
110
-
111
-
112
-
113
-
114
-
115
-
116
-
117
-
118
-
119
-
120
-
121
-
122
-
123
-
124
-
125
-
126
-
127
-
128
 |
 |

Humana Inc.
NOTES TO CONSOLIDATED FINANCIAL STATEMENTS—(Continued)
Shelf Registration
Our universal shelf registration with the Securities and Exchange Commission allows us to register debt or
equity securities, from time to time, with the amount, price and terms to be determined at the time of the sale. We
have up to $300 million remaining from a total of $600 million under the universal shelf registration. The net
proceeds from any future sales of our debt securities under the universal shelf registration may be used for our
operations and for other general corporate purposes, including repayment or refinancing of borrowings, working
capital, capital expenditures, investments, acquisitions, or the repurchase of our outstanding securities.
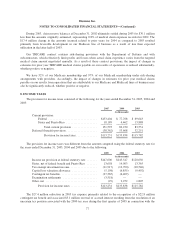
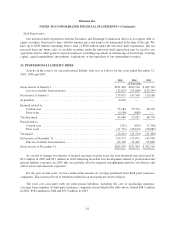
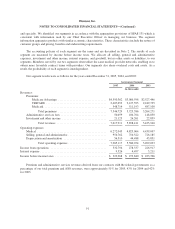
10. PROFESSIONAL LIABILITY RISKS
Activity in the reserve for our professional liability risks was as follows for the years ended December 31,
2005, 2004 and 2003:
2005 2004 2003
(in thousands)
Gross reserve at January 1 ........................................ $231,494 $242,516 $ 262,763
Less recoverables from insurance ............................... (52,423) (95,008) (142,595)
Net reserve at January 1 .......................................... 179,071 147,508 120,168
Acquisition .................................................... 8,276 — —
Incurred related to:
Current year ............................................... 53,184 53,525 48,778
Prior years ................................................. (9,196) (688) —
Total incurred .................................................. 43,988 52,837 48,778
Paid related to:
Current year ............................................... (251) (659) (1,356)
Prior years ................................................. (11,771) (20,615) (20,082)
Total paid ..................................................... (12,022) (21,274) (21,438)
Net reserve at December 31 ....................................... 219,313 179,071 147,508
Plus recoverables from insurance ............................... 65,790 52,423 95,008
Gross reserve at December 31 ..................................... $285,103 $231,494 $ 242,516
As a result of changes in estimates of insured exposures in prior years, the total incurred losses decreased by
$9.2 million in 2005 and $0.7 million in 2004 reflecting favorable loss development related to professional and
general liability exposures. In 2004, this was partially offset by required strengthening related to our director and
officer errors and omissions exposures.
For the past several years, we have reduced the amount of coverage purchased from third party insurance
companies. This increased level of retention resulted in an increasing net reserve balance.
The total cost associated with our professional liabilities, including the cost of purchasing insurance
coverage from a number of third party insurance companies not included in the table above, totaled $48.2 million
in 2005, $58.4 million in 2004 and $52.5 million in 2003.
81