Proctor and Gamble 2013 Annual Report Download - page 15
Download and view the complete annual report
Please find page 15 of the 2013 Proctor and Gamble annual report below. You can navigate through the pages in the report by either clicking on the pages listed below, or by using the keyword search tool below to find specific information within the annual report.-
 1
1 -
2
-
3
-
4
-
 5
5 -
 6
6 -
 7
7 -
 8
8 -
 9
9 -
 10
10 -
 11
11 -
 12
12 -
 13
13 -
 14
14 -
 15
15 -
 16
16 -
 17
17 -
 18
18 -
 19
19 -
 20
20 -
 21
21 -
 22
22 -
 23
23 -
 24
24 -
 25
25 -
26
-
27
-
28
-
29
-
30
-
31
-
32
-
33
-
34
-
35
-
36
-
37
-
38
-
39
-
40
-
41
-
42
-
43
-
44
-
45
-
46
-
47
-
48
-
49
-
50
-
51
-
52
-
53
-
54
-
55
-
56
-
57
-
58
-
59
-
60
-
61
-
62
-
63
-
64
-
65
-
66
-
67
-
68
-
69
-
70
-
71
-
72
-
73
-
74
-
75
-
76
-
77
-
78
-
79
-
80
-
81
-
82
-
83
-
84
-
85
-
86
-
87
-
88
-
89
-
90
-
91
-
92
 |
 |

The Procter & Gamble Company 13
PART I
Item 1. Business.
Additional information required by this item is incorporated
herein by reference to Management's Discussion and
Analysis (MD&A); Note 1 to our Consolidated Financial
Statements and Note 12 to our Consolidated Financial
Statements. Unless the context indicates otherwise, the terms
the "Company," "P&G," "we," "our" or "us" as used herein
refer to The Procter & Gamble Company (the registrant) and
its subsidiaries.
The Procter & Gamble Company is focused on providing
branded consumer packaged goods of superior quality and
value to improve the lives of the world's consumers. The
Company was incorporated in Ohio in 1905, having been
built from a business founded in 1837 by William Procter
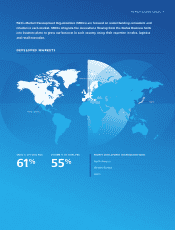
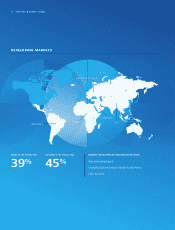
and James Gamble. Today, we sell our products in more than
180 countries and territories.
Throughout this Form 10-K, we incorporate by reference
information from other documents filed with the Securities
and Exchange Commission (SEC).
The Company's annual report on Form 10-K, quarterly
reports on Form 10-Q and current reports on Form 8-K, and
amendments thereto, are filed electronically with the SEC.
The SEC maintains an internet site that contains these
reports at: www.sec.gov. You can also access these reports
through links from our website at: www.pg.com/investors.
Copies of these reports are also available, without charge, by
contacting Computershare Inc., 250 Royall Street, Canton,
MA 02021.
Financial Information about Segments
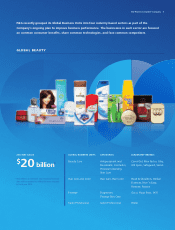
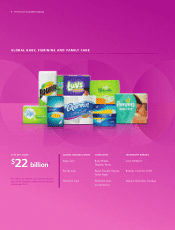
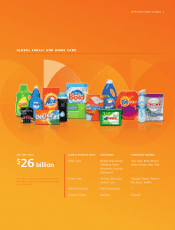
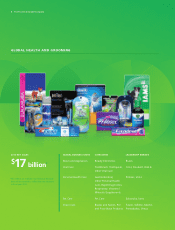
As of June 30, 2013, the Company has five reportable
segments under U.S. GAAP: Beauty; Grooming; Health
Care; Fabric Care and Home Care; and Baby Care and
Family Care. Many of the factors necessary for
understanding these businesses are similar. Operating
margins of the individual businesses vary due to the nature
of materials and processes used to manufacture the products,
the capital intensity of the businesses and differences in
selling, general and administrative expenses as a percentage
of net sales. Net sales growth by business is also expected to
vary slightly due to the underlying growth of the markets
and product categories in which they operate. While none of
our reportable segments are highly seasonal, components
within certain reportable segments, such as Batteries (Fabric
Care and Home Care), Appliances (Grooming) and Prestige
Fragrances (Beauty) are seasonal. In addition, anticipation
or occurrence of natural disasters, such as hurricanes, can
drive unusually high demand for batteries.
Additional information about our reportable segments can be
found in MD&A and Note 12 to our Consolidated Financial
Statements.
Narrative Description of Business
Business Model. Our business model relies on the
continued growth and success of existing brands and
products, as well as the creation of new products. The
markets and industry segments in which we offer our
products are highly competitive. Our products are sold in
more than 180 countries and territories around the world
primarily through mass merchandisers, grocery stores,
membership club stores, drug stores, department stores,
salons, e-commerce and high-frequency stores, the
neighborhood stores which serve many consumers in
developing markets. We work collaboratively with our
customers to improve the in-store presence of our products
and win the "first moment of truth" - when a consumer is
shopping in the store. We must also win the "second
moment of truth" - when a consumer uses the product,
evaluates how well it met his or her expectations and decides
whether it was a good value. We believe we must continue
to provide new, innovative products and branding to the
consumer in order to grow our business. Research and
product development activities, designed to enable sustained
organic growth, continued to carry a high priority during the
past fiscal year. While many of the benefits from these
efforts will not be realized until future years, we believe
these activities demonstrate our commitment to future
growth.
Key Product Categories. Information on key product
categories can be found in Note 12 to our Consolidated
Financial Statements.
Key Customers. Our customers include mass
merchandisers, grocery stores, membership club stores, drug
stores, high-frequency stores, distributors and e-commerce
retailers. Sales to Wal-Mart Stores, Inc. and its affiliates
represent approximately 14% of our total revenue in 2013
and 2012, and 15% in 2011. No other customer represents
more than 10% of our net sales. Our top ten customers
account for approximately 30%, 31% and 32% of our total
unit volume in 2013, 2012 and 2011, respectively. The
nature of our business results in no material backlog orders
or contracts with the government. We believe our practices
related to working capital items for customers and suppliers
are consistent with the industry segments in which we
compete.
Sources and Availability of Materials. Almost all of the
raw and packaging materials used by the Company are
purchased from others, some of which are single-source
suppliers. We produce certain raw materials, primarily
chemicals, for further use in the manufacturing process. In
addition, fuel, natural gas and derivative products are
important commodities consumed in our manufacturing
process and in the distribution of input materials and finished
product to customers. The prices we pay for materials and