Proctor and Gamble 2013 Annual Report Download - page 3
Download and view the complete annual report
Please find page 3 of the 2013 Proctor and Gamble annual report below. You can navigate through the pages in the report by either clicking on the pages listed below, or by using the keyword search tool below to find specific information within the annual report.-
 1
1 -
 2
2 -
 3
3 -
 4
4 -
 5
5 -
 6
6 -
 7
7 -
 8
8 -
 9
9 -
 10
10 -
 11
11 -
 12
12 -
 13
13 -
 14
14 -
15
-
16
-
17
-
18
-
19
-
20
-
21
-
22
-
23
-
24
-
25
-
26
-
27
-
28
-
29
-
30
-
31
-
32
-
33
-
34
-
35
-
36
-
37
-
38
-
39
-
40
-
41
-
42
-
43
-
44
-
45
-
46
-
47
-
48
-
49
-
50
-
51
-
52
-
53
-
54
-
55
-
56
-
57
-
58
-
59
-
60
-
61
-
62
-
63
-
64
-
65
-
66
-
67
-
68
-
69
-
70
-
71
-
72
-
73
-
74
-
75
-
76
-
77
-
78
-
79
-
80
-
81
-
82
-
83
-
84
-
85
-
86
-
87
-
88
-
89
-
90
-
91
-
92
 |
 |

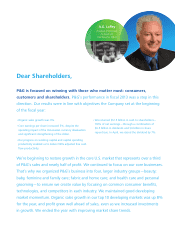
Dear Shareholders,
P&G is focused on winning with those who matter most: consumers,
customers and shareholders. P&G’s performance in fiscal 2013 was a step in this
direction. Our results were in line with objectives the Company set at the beginning
of the fiscal year:
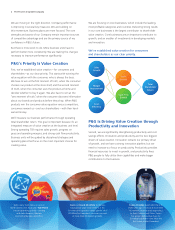
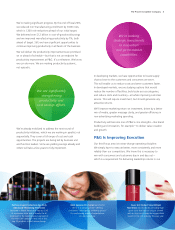
We’re beginning to restore growth in the core U.S. market that represents over a third
of P&G’s sales and nearly half of profit. We continued to focus on our core businesses.
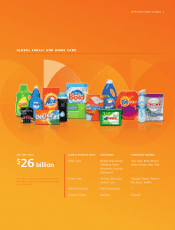
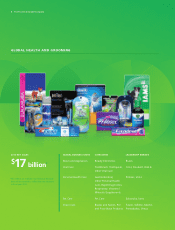
That’s why we organized P&G’s businesses into four, larger industry groups
—
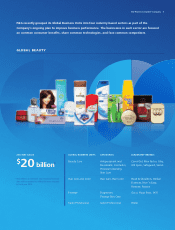
beauty;
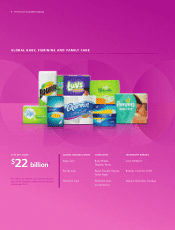
baby, feminine and family care; fabric and home care; and health care and personal
grooming
—
to ensure we create value by focusing on common consumer benefits,
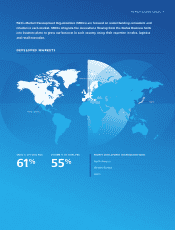
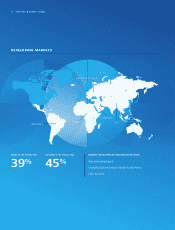
technologies, and competitors in each industry. We maintained good developing
market momentum. Organic sales growth in our top 10 developing markets was up 8%
for the year, and profit grew well ahead of sales, even as we increased investments
in growth. We ended the year with improving market share trends.
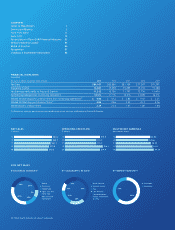
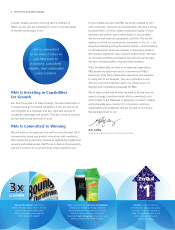
• Organic sales growth was 3%.
• Core earnings per share increased 5%, despite the
operating impact of the Venezuelan currency devaluation
and significant strengthening of the dollar.
• Our progress on working capital and capital spending
productivity enabled us to deliver 98% adjusted free cash
flow productivity.
• We returned $12.5 billion in cash to shareholders
—
110% of net earnings
—
through a combination of
$6.5billion in dividends and $6 billion in share
repurchase. In April, we raised the dividend by 7%.
A.G. Lafley
Chairman of the Board,
President and
Chief Executive Officer
We’re beginning to restore growth in the core U.S. market that represents over a third
of P&G’s sales and nearly half of profit. We continued to focus on our core businesses.
That’s why we organized P&G’s business into four, larger industry groups
—
beauty;
baby, feminine and family care; fabric and home care; and health care and personal
grooming
—
to ensure we create value by focusing on common consumer benefits,
technologies, and competitors in each industry. We maintained good developing
market momentum. Organic sales growth in our top 10 developing markets was up 8%
for the year, and profit grew well ahead of sales, even as we increased investments
in growth. We ended the year with improving market share trends.