Proctor and Gamble 2013 Annual Report Download - page 87
Download and view the complete annual report
Please find page 87 of the 2013 Proctor and Gamble annual report below. You can navigate through the pages in the report by either clicking on the pages listed below, or by using the keyword search tool below to find specific information within the annual report.-
 1
1 -
2
-
3
-
4
-
5
-
6
-
7
-
8
-
9
-
10
-
11
-
12
-
13
-
14
-
15
-
16
-
17
-
18
-
19
-
20
-
21
-
22
-
23
-
24
-
25
-
26
-
27
-
28
-
29
-
30
-
31
-
32
-
33
-
34
-
35
-
36
-
37
-
38
-
39
-
40
-
41
-
42
-
43
-
44
-
45
-
46
-
47
-
48
-
49
-
50
-
51
-
52
-
53
-
54
-
55
-
56
-
57
-
58
-
59
-
60
-
61
-
62
-
63
-
64
-
65
-
66
-
67
-
68
-
69
-
70
-
71
-
72
-
73
-
74
-
75
-
76
-
 77
77 -
 78
78 -
 79
79 -
 80
80 -
 81
81 -
 82
82 -
 83
83 -
 84
84 -
 85
85 -
 86
86 -
 87
87 -
 88
88 -
 89
89 -
 90
90 -
 91
91 -
 92
92
 |
 |

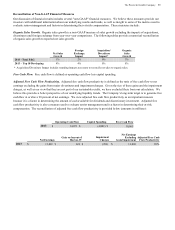
Reconciliation of Non-GAAP Financial Measures
Our discussion of financial results includes several "non-GAAP" financial measures. We believe these measures provide our
investors with additional information about our underlying results and trends, as well as insight to some of the metrics used to
evaluate senior management and factors in determining their at-risk compensation. These measures include:
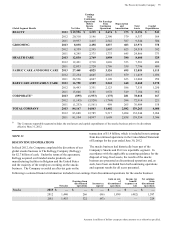
Organic Sales Growth. Organic sales growth is a non-GAAP measure of sales growth excluding the impacts of acquisitions,
divestitures and foreign exchange from year-over-year comparisons. The following tables provide a numerical reconciliation
of organic sales growth to reported net sales growth:
Net Sales
Growth
Foreign
Exchange
Impact
Acquisition/
Divestiture
Impact*
Organic
Sales
Growth
2013 -Total P&G
1%
2%
0%
3%
2013 –Top 10 Developing
4%
4%
0%
8%
* Acquisition/Divestiture Impact includes rounding impacts necessary to reconcile net sales to organic sales.
Free Cash Flow. Free cash flow is defined as operating cash flow less capital spending.
Adjusted Free Cash Flow Productivity. Adjusted free cash flow productivity is defined as the ratio of free cash flow to net
earnings excluding the gains from major divestitures and impairment charges. Given the size of these gains and the impairment
charges, as well as our view that they are not part of our sustainable results, we have excluded these from our calculation. We
believe this provides a better perspective of our underlying liquidity trends. The Company’s long-term target is to generate free
cash flow at or above 90 percent of net earnings. We view adjusted free cash flow productivity as an important measure
because it is a factor in determining the amount of cash available for dividends and discretionary investment. Adjusted free
cash flow productivity is also a measure used to evaluate senior management and is a factor in determining their at-risk
compensation. The reconciliation of adjusted free cash flow productivity is provided below (amounts in millions):
Operating Cash Flow
Capital Spending
Free Cash Flow
2013
$
14,873
$
(4,008
)
$
10,865
Net Earnings
Gain on buyout of
Iberian JV
Impairment
Charges
Net Earnings
Excluding
Gain/Impairment
Adjusted Free Cash
Flow Productivity
2013
$
11,402
$
623
$
(290
)
$
11,069
98
%
The Procter & Gamble Company 85