Proctor and Gamble 2013 Annual Report Download - page 34
Download and view the complete annual report
Please find page 34 of the 2013 Proctor and Gamble annual report below. You can navigate through the pages in the report by either clicking on the pages listed below, or by using the keyword search tool below to find specific information within the annual report.-
 1
1 -
2
-
3
-
4
-
5
-
6
-
7
-
8
-
9
-
10
-
11
-
12
-
13
-
14
-
15
-
16
-
17
-
18
-
19
-
20
-
21
-
22
-
23
-
 24
24 -
 25
25 -
 26
26 -
 27
27 -
 28
28 -
 29
29 -
 30
30 -
 31
31 -
 32
32 -
 33
33 -
 34
34 -
 35
35 -
 36
36 -
 37
37 -
 38
38 -
 39
39 -
 40
40 -
 41
41 -
 42
42 -
 43
43 -
 44
44 -
45
-
46
-
47
-
48
-
49
-
50
-
51
-
52
-
53
-
54
-
55
-
56
-
57
-
58
-
59
-
60
-
61
-
62
-
63
-
64
-
65
-
66
-
67
-
68
-
69
-
70
-
71
-
72
-
73
-
74
-
75
-
76
-
77
-
78
-
79
-
80
-
81
-
82
-
83
-
84
-
85
-
86
-
87
-
88
-
89
-
90
-
91
-
92
 |
 |

32 The Procter & Gamble Company
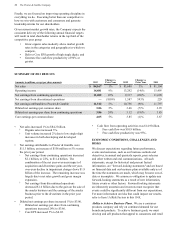
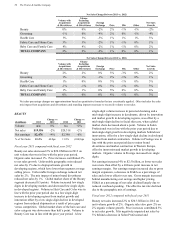
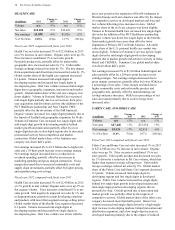
Net Sales Change Drivers (2013 vs. 2012)
Volume with
Acquisitions
& Divestitures
Volume
Excluding
Acquisitions
& Divestitures
Foreign
Exchange Price Mix Other
Net Sales
Growth
Beauty 0% 0% -2% 2% -1% -1% -2%
Grooming -1% 0% -4% 2% 0% -1% -4%
Health Care 3% 3% -3% 1% 1% 1% 3%
Fabric Care and Home Care 3% 3% -2% 1% -1% 0% 1%
Baby Care and Family Care 4% 4% -2% 1% -1% 0% 2%
TOTAL COMPANY 2% 2% -2% 1% 0% 0% 1%
Net Sales Change Drivers (2012 vs. 2011)
Volume with
Acquisitions
& Divestitures
Volume
Excluding
Acquisitions
& Divestitures
Foreign
Exchange Price Mix Other
Net Sales
Growth
Beauty 2% 2% 0% 3% -3% 0% 2%
Grooming 1% 1% -1% 2% -1% 0% 1%
Health Care 1% 0% 0% 3% -1% 0% 3%
Fabric Care and Home Care -1% -1% 0% 5% -1% 0% 3%
Baby Care and Family Care 1% 1% 0% 5% 0% 0% 6%
TOTAL COMPANY 0% 0% 0% 4% -1% 0% 3%
Net sales percentage changes are approximations based on quantitative formulas that are consistently applied. Other includes the sales
mix impact from acquisitions and divestitures and rounding impacts necessary to reconcile volume to net sales.
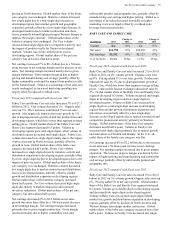
BEAUTY
($ millions) 2013
Change vs
2012 2012
Change vs
2011
Volume n/a 0% n/a +2%
Net sales $19,956 -2% $20,318 +2%
Net earnings $2,474 +4% $2,390 -6%
% of Net Sales 12.4% 60 bps 11.8% (100) bps
Fiscal year 2013 compared with fiscal year 2012
Beauty net sales decreased 2% to $20.0 billion in 2013 on
unit volume that was in line with the prior year period.
Organic sales increased 1%. Price increases contributed 2%
to net sales growth. Unfavorable geographic mix reduced
net sales by 1% due to disproportionate growth in
developing regions, which have lower than segment average
selling prices. Unfavorable foreign exchange reduced net
sales by 2%. The mix impact of minor brand divestitures
reduced net sales by 1%. Global market share of the Beauty
segment decreased 0.5 points. Volume increased low single
digits in developing markets and decreased low single digits
in developed regions. Volume in Hair Care and Color was in
line with the prior year period due to a low single-digit
increase in developing regions from market growth and
innovation offset by a low single-digit decline in developed
regions from reduced shipments as a result of price gaps
versus competition. Global market share of the hair care and
color category was down more than half a point. Volume in
Beauty Care was in line with the prior year period. A low
single-digit volume increase in personal cleansing and a
mid-single-digit increase in deodorants, driven by innovation
and market growth in developing regions, was offset by a
mid-single-digit decline in facial skin care, where global
market share decreased about a point. Volume in Salon
Professional was in line with the prior year period due to
mid-single-digit growth in developing markets behind new
innovations, offset by a low single-digit decline in developed
regions from market contraction. Volume in Prestige was in
line with the prior year period due to minor brand
divestitures and market contraction in Western Europe,
offset by innovation and market growth in developing
markets. Organic volume in Prestige increased low single
digits.
Net earnings increased 4% to $2.5 billion, as lower net sales
were more than offset by a 60-basis point increase in net
earnings margin. Net earnings margin increased due to gross
margin expansion, a decrease in SG&A as a percentage of
sales and a lower effective tax rate. Gross margin increased
behind manufacturing cost savings and higher pricing.
SG&A as a percentage of net sales declined largely due to
reduced overhead spending. The effective tax rate declined
due to the geographic mix of earnings.
Fiscal year 2012 compared with fiscal year 2011
Beauty net sales increased 2% to $20.3 billion in 2012 on
unit volume growth of 2%. Organic sales also grew 2% on
2% organic volume growth. Price increases contributed 3%
to net sales growth. Mix negatively impacted net sales by
3% behind a decrease in Salon Professional and