Proctor and Gamble 2013 Annual Report Download - page 77
Download and view the complete annual report
Please find page 77 of the 2013 Proctor and Gamble annual report below. You can navigate through the pages in the report by either clicking on the pages listed below, or by using the keyword search tool below to find specific information within the annual report.-
 1
1 -
2
-
3
-
4
-
5
-
6
-
7
-
8
-
9
-
10
-
11
-
12
-
13
-
14
-
15
-
16
-
17
-
18
-
19
-
20
-
21
-
22
-
23
-
24
-
25
-
26
-
27
-
28
-
29
-
30
-
31
-
32
-
33
-
34
-
35
-
36
-
37
-
38
-
39
-
40
-
41
-
42
-
43
-
44
-
45
-
46
-
47
-
48
-
49
-
50
-
51
-
52
-
53
-
54
-
55
-
56
-
57
-
58
-
59
-
60
-
61
-
62
-
63
-
64
-
65
-
66
-
 67
67 -
 68
68 -
 69
69 -
 70
70 -
 71
71 -
 72
72 -
 73
73 -
 74
74 -
 75
75 -
 76
76 -
 77
77 -
 78
78 -
 79
79 -
 80
80 -
 81
81 -
 82
82 -
 83
83 -
 84
84 -
 85
85 -
 86
86 -
 87
87 -
88
-
89
-
90
-
91
-
92
 |
 |
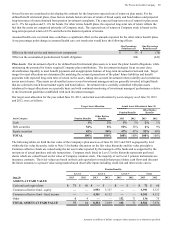
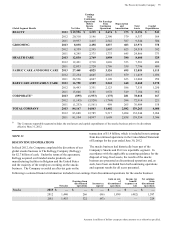
The Procter & Gamble Company 75
Amounts in millions of dollars except per share amounts or as otherwise specified.
Global Segment Results Net Sales
Earnings
from
Continuing
Operations
Before
Income
Taxes
Net Earnings
from
Continuing
Operations
Depreciation
and
Amortization
Total
Assets
Capital
Expenditures
BEAUTY 2013 $ 19,956 $ 3,215 $ 2,474 $ 375 $ 8,396 $ 541
2012 20,318 3,196 2,390 379 8,357 569
2011 19,937 3,415 2,542 387 9,544 504
GROOMING 2013 8,038 2,458 1,837 603 23,971 378
2012 8,339 2,395 1,807 623 24,518 392
2011 8,245 2,375 1,775 645 24,866 373
HEALTH CARE 2013 12,830 2,769 1,898 380 8,400 529
2012 12,421 2,718 1,826 353 7,501 496
2011 12,033 2,720 1,796 359 7,796 409
FABRIC CARE AND HOME CARE 2013 27,448 4,825 3,126 695 12,018 1,115
2012 27,254 4,645 2,915 679 11,419 1,036
2011 26,536 4,867 3,109 633 12,060 950
BABY CARE AND FAMILY CARE 2013 16,790 3,509 2,242 648 8,460 1,278
2012 16,493 3,351 2,123 586 7,535 1,250
2011 15,606 3,181 1,978 549 7,184 912
CORPORATE(1) 2013 (895) (1,933)(175) 281 78,018 167
2012 (1,145) (3,520)(1,744) 584 72,914 221
2011 (1,253) (1,561) 498 265 76,904 158
TOTAL COMPANY 2013 84,167 14,843 11,402 2,982 139,263 4,008
2012 83,680 12,785 9,317 3,204 132,244 3,964
2011 81,104 14,997 11,698 2,838 138,354 3,306
(1) The Corporate reportable segment includes the total assets and capital expenditures of the snacks business prior to its divestiture
effective May 31, 2012.
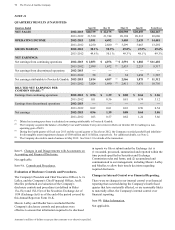
NOTE 13
DISCONTINUED OPERATIONS
In fiscal 2012, the Company completed the divestiture of our
global snacks business to The Kellogg Company (Kellogg)
for $2.7 billion of cash. Under the terms of the agreement,
Kellogg acquired our branded snacks products, our
manufacturing facilities in Belgium and the United States
and the majority of the employees working on the snacks
business. The Company recorded an after-tax gain on the
transaction of $1.4 billion, which is included in net earnings
from discontinued operations in the Consolidated Statement
of Earnings for the year ended June 30, 2012.
The snacks business had historically been part of the
Company's Snacks and Pet Care reportable segment. In
accordance with the applicable accounting guidance for the
disposal of long-lived assets, the results of the snacks
business are presented as discontinued operations and, as
such, have been excluded from both continuing operations
and segment results for all years presented.
Following is selected financial information included in net earnings from discontinued operations for the snacks business:
Net sales
Earnings from
discontinued
operations
Income tax
expense
Gain on sale
of
discontinued
operations
Income tax
benefit/
(expense) on
sale
Net earnings
from
discontinued
operations
Snacks 2013$ —$ —$ —$ —$ —$ —
2012 1,440 266 (96) 1,899 (482) 1,587
2011 1,455 322 (93) — — 229