Proctor and Gamble 2013 Annual Report Download - page 45
Download and view the complete annual report
Please find page 45 of the 2013 Proctor and Gamble annual report below. You can navigate through the pages in the report by either clicking on the pages listed below, or by using the keyword search tool below to find specific information within the annual report.-
 1
1 -
2
-
3
-
4
-
5
-
6
-
7
-
8
-
9
-
10
-
11
-
12
-
13
-
14
-
15
-
16
-
17
-
18
-
19
-
20
-
21
-
22
-
23
-
24
-
25
-
26
-
27
-
28
-
29
-
30
-
31
-
32
-
33
-
34
-
 35
35 -
 36
36 -
 37
37 -
 38
38 -
 39
39 -
 40
40 -
 41
41 -
 42
42 -
 43
43 -
 44
44 -
 45
45 -
 46
46 -
 47
47 -
 48
48 -
 49
49 -
 50
50 -
 51
51 -
 52
52 -
 53
53 -
 54
54 -
 55
55 -
56
-
57
-
58
-
59
-
60
-
61
-
62
-
63
-
64
-
65
-
66
-
67
-
68
-
69
-
70
-
71
-
72
-
73
-
74
-
75
-
76
-
77
-
78
-
79
-
80
-
81
-
82
-
83
-
84
-
85
-
86
-
87
-
88
-
89
-
90
-
91
-
92
 |
 |

The Procter & Gamble Company 43
historical interest rate movements, would not materially
affect our financial statements.
Currency Rate Exposure on Financial Instruments.
Because we manufacture and sell products and finance
operations in a number of countries throughout the world,
we are exposed to the impact on revenue and expenses of
movements in currency exchange rates. Corporate policy
prescribes the range of allowable hedging activity. To
manage the exchange rate risk associated with our financing
operations, we primarily use forward contracts with
maturities of less than 18 months. In addition, we enter into
certain currency swaps with maturities of up to five years to
hedge our exposure to exchange rate movements on
intercompany financing transactions.
Based on our currency rate exposure on derivative and other
instruments as of and during the year ended June 30, 2013,
we believe, at a 95% confidence level based on historical
currency rate movements, the impact of a near-term change
in currency rates would not materially affect our financial
statements.
Commodity Price Exposure on Financial Instruments. We
use raw materials that are subject to price volatility caused
by weather, supply conditions, political and economic
variables and other unpredictable factors. In addition to
fixed price contracts, we may use futures, options and swap
contracts to manage the volatility related to the above
exposures.
As of and during the year ended June 30, 2013, we did not
have material commodity hedging activity.
Measures Not Defined By U.S. GAAP
Our discussion of financial results includes several "non-
GAAP" financial measures. We believe these measures
provide our investors with additional information about our
underlying results and trends, as well as insight to some of
the metrics used to evaluate management. When used in
MD&A, we have provided the comparable GAAP measure
in the discussion. These measures include:
Organic Sales Growth. Organic sales growth is a non-
GAAP measure of sales growth excluding the impacts of
acquisitions, divestitures and foreign exchange from year-
over-year comparisons. We believe this provides investors
with a more complete understanding of underlying sales
trends by providing sales growth on a consistent basis.
Organic sales is also one of the measures used to evaluate
senior management and is a factor in determining their at-
risk compensation.
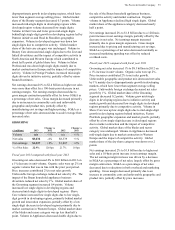
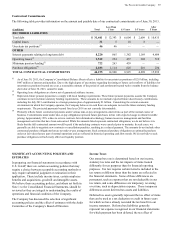
The following tables provide a numerical reconciliation of
organic sales growth to reported net sales growth:
Year ended
June 30, 2013
Net Sales
Growth
Foreign
Exchange
Impact
Acquisition/
Divestiture
Impact*
Organic
Sales
Growth
Beauty -2% 2% 1% 1%
Grooming -4% 4% 2% 2%
Health Care 3% 3% -1% 5%
Fabric Care
and Home
Care 1% 2% 0% 3%
Baby Care
and Family
Care 2% 2% 0% 4%
TOTAL
COMPANY 1% 2% 0% 3%
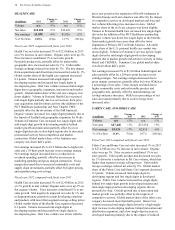
Year ended
June 30, 2012
Net Sales
Growth
Foreign
Exchange
Impact
Acquisition/
Divestiture
Impact*
Organic
Sales
Growth
Beauty 2 % 0 % 0 % 2 %
Grooming 1% 1% 0% 2%
HealthCare 3% 0% -1% 2%
Fabric Care
and Home
Care 3% 0% 0% 3%
Baby Care
and Family
Care 6% 0% 0% 6%
TOTAL
COMPANY 3% 0% 0% 3%
* Acquisition/Divestiture Impact includes rounding impacts
necessary to reconcile net sales to organic sales.
Core EPS. This is a measure of the Company's diluted net
earnings per share from continuing operations excluding
certain items that are not judged to be part of the Company's
sustainable results or trends. This includes a charge in 2013
for the balance sheet impact from the devaluation of the
official foreign exchange rate in Venezuela, a holding gain in
2013 on the purchase of the balance of our Iberian joint
venture, impairment charges in 2013 and 2012 for goodwill
and indefinite-lived intangible assets, charges in 2013 and
2012 related to incremental restructuring due to increased
focus on productivity and cost savings, a significant benefit
in 2011 from the settlement of U.S. tax litigation primarily
related to the valuation of technology donations and charges
in 2013, 2012 and 2011 related to pending European legal
matters. We do not view these items to be part of our
sustainable results. We believe the Core EPS measure
provides an important perspective of underlying business
trends and results and provides a more comparable measure
of year-on-year earnings per share growth. Core EPS is also
one of the measures used to evaluate senior management and
is a factor in determining their at-risk compensation.