Proctor and Gamble 2013 Annual Report Download - page 38
Download and view the complete annual report
Please find page 38 of the 2013 Proctor and Gamble annual report below. You can navigate through the pages in the report by either clicking on the pages listed below, or by using the keyword search tool below to find specific information within the annual report.-
 1
1 -
2
-
3
-
4
-
5
-
6
-
7
-
8
-
9
-
10
-
11
-
12
-
13
-
14
-
15
-
16
-
17
-
18
-
19
-
20
-
21
-
22
-
23
-
24
-
25
-
26
-
27
-
 28
28 -
 29
29 -
 30
30 -
 31
31 -
 32
32 -
 33
33 -
 34
34 -
 35
35 -
 36
36 -
 37
37 -
 38
38 -
 39
39 -
 40
40 -
 41
41 -
 42
42 -
 43
43 -
 44
44 -
 45
45 -
 46
46 -
 47
47 -
 48
48 -
49
-
50
-
51
-
52
-
53
-
54
-
55
-
56
-
57
-
58
-
59
-
60
-
61
-
62
-
63
-
64
-
65
-
66
-
67
-
68
-
69
-
70
-
71
-
72
-
73
-
74
-
75
-
76
-
77
-
78
-
79
-
80
-
81
-
82
-
83
-
84
-
85
-
86
-
87
-
88
-
89
-
90
-
91
-
92
 |
 |

36 The Procter & Gamble Company
digits primarily due to competitive activity and the impact of
a price increase in North America. In the U.S., all-outlet
share of the family care category was down half a point.
Net earnings increased 7% to $2.1 billion due to sales
growth and a 20-basis point increase in net earnings margin.
Net earnings margin increased mainly due to a decrease in
SG&A as a percentage of net sales, partially offset by a
lower gross margin. The reduction in gross margin was
driven primarily by higher commodity costs and unfavorable
geographic and product mix, partially offset by the impact of
higher pricing. SG&A as a percentage of net sales decreased
due to scale leverage from increased sales.
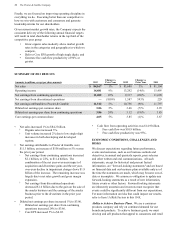
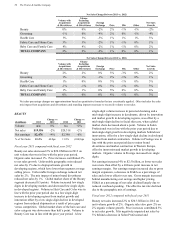
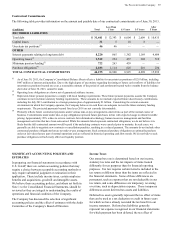
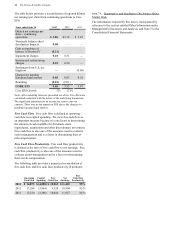
CORPORATE
($ millions) 2013
Change vs
2012 2012
Change vs
2011
Net sales $(895) -22% $(1,145) -9%
Net earnings $(175) N/A $(1,744) N/A
Corporate includes certain operating and non-operating
activities not allocated to specific business units. These
include: the incidental businesses managed at the corporate
level; financing and investing activities; other general
corporate items; the historical results of certain divested
brands and categories; certain asset impairment charges; and
certain restructuring-type activities to maintain a competitive
cost structure, including manufacturing and workforce
optimization. Corporate also includes reconciling items to
adjust the accounting policies used in the segments to U.S.
GAAP. The most significant reconciling items include
income taxes (to adjust from statutory rates that are reflected
in the segments to the overall Company effective tax rate),
adjustments for unconsolidated entities (to eliminate net
sales, cost of products sold and SG&A for entities that are
consolidated in the segments but accounted for using the
equity method for U.S. GAAP) and noncontrolling interest
adjustments for subsidiaries where we do not have 100%
ownership. Since certain unconsolidated entities and less
than 100%-owned subsidiaries are managed as integral parts
of the related segments, they are accounted for similar to a
wholly-owned subsidiary for management and segment
purposes. This means our segment results recognize 100%
of each income statement component through before-tax
earnings in the segments, with eliminations for
unconsolidated entities and noncontrolling interests in
Corporate. In determining segment net earnings, we apply
the statutory tax rates (with adjustments to arrive at the
Company's effective tax rate in Corporate) and eliminate the
share of earnings applicable to other ownership interests, in
a manner similar to noncontrolling interest.
Corporate net sales primarily reflect the adjustment to
eliminate the sales of unconsolidated entities included in
business segment results. Accordingly, Corporate net sales
are generally negative. Negative net sales in Corporate for
2013 decreased by $250 million due to 1) the purchase of the
balance of our Iberian joint venture (after which this
business is consolidated for both segment and consolidated
results and the underlying sales no longer need to be
eliminated) and 2) smaller adjustments required to eliminate
reduced sales of the remaining unconsolidated entities.
Corporate net earnings improved $1.6 billion primarily due
to reduced net after-tax goodwill and intangible asset
impairment charges (which totaled $1.5 billion in the prior
year as compared to $290 million in the current period),
along with the current year net after-tax holding gain related
to the purchase of the balance of our Iberian joint venture,
partially offset by the current year charge for the impact of
the Venezuela devaluation. Additional discussion of the
items impacting net earnings in Corporate are included in the
Results of Operations section.
In 2012, negative net sales in Corporate decreased by $108
million due to adjustments required to eliminate the lower
net sales of unconsolidated entities. Corporate net earnings
declined $2.2 billion primarily due to the net after tax
goodwill and intangible asset impairment charges of $1.5
billion, incremental after-tax restructuring charges of $587
million and the impact of lower net discrete tax adjustments
in 2012. Additional discussion of the items impacting net
earnings in Corporate are included in the Results of
Operations section above.
Productivity and Cost Savings Plan
In February and November 2012, the Company made
announcements related to a productivity and cost savings
plan to reduce costs and better leverage scale in the areas of
supply chain, research and development, marketing and
overheads. The plan was designed to accelerate cost
reductions by streamlining management decision making,
manufacturing and other work processes to fund the
Company's growth strategy.
As part of this plan, the Company expects to incur in excess
of $3.5 billion in before-tax restructuring costs over a five-
year period (from fiscal 2012 through fiscal 2016).
Approximately 55% of the costs have been incurred through
the end of fiscal 2013. Savings generated from the
restructuring costs are difficult to estimate, given the nature
of the activities, the corollary benefits achieved, the timing
of the execution and the degree of reinvestment. Overall,
the costs are expected to deliver in excess of $2 billion in
before-tax annual savings. The cumulative before-tax
savings realized as a result of restructuring costs incurred
through 2013 were approximately $940 million.
Restructuring accruals of $323 million as of June 30, 2013,
are classified as current liabilities. Approximately 86% of
the restructuring charges incurred during fiscal 2013 either
have been or will be settled with cash. Consistent with our
historical policies for ongoing restructuring-type activities,
the resulting charges are funded by and included within
Corporate for segment reporting.
Refer to Note 3 to our Consolidated Financial Statements for
more details on the restructuring program.