Proctor and Gamble 2013 Annual Report Download - page 64
Download and view the complete annual report
Please find page 64 of the 2013 Proctor and Gamble annual report below. You can navigate through the pages in the report by either clicking on the pages listed below, or by using the keyword search tool below to find specific information within the annual report.-
 1
1 -
2
-
3
-
4
-
5
-
6
-
7
-
8
-
9
-
10
-
11
-
12
-
13
-
14
-
15
-
16
-
17
-
18
-
19
-
20
-
21
-
22
-
23
-
24
-
25
-
26
-
27
-
28
-
29
-
30
-
31
-
32
-
33
-
34
-
35
-
36
-
37
-
38
-
39
-
40
-
41
-
42
-
43
-
44
-
45
-
46
-
47
-
48
-
49
-
50
-
51
-
52
-
53
-
 54
54 -
 55
55 -
 56
56 -
 57
57 -
 58
58 -
 59
59 -
 60
60 -
 61
61 -
 62
62 -
 63
63 -
 64
64 -
 65
65 -
 66
66 -
 67
67 -
 68
68 -
 69
69 -
 70
70 -
 71
71 -
 72
72 -
 73
73 -
 74
74 -
75
-
76
-
77
-
78
-
79
-
80
-
81
-
82
-
83
-
84
-
85
-
86
-
87
-
88
-
89
-
90
-
91
-
92
 |
 |
62 The Procter & Gamble Company
Amounts in millions of dollars except per share amounts or as otherwise specified.
During fiscal 2013 and 2012, we recorded impairments of certain goodwill and intangible assets. Also, during fiscal 2013, we
applied purchase accounting and re-measured assets and liabilities at fair value related to the purchase of the balance of a joint
venture in Iberia (see Note 2 for additional details on these items). In addition, the Company re-measured certain operating real
estate assets to an estimated fair value of $8 during the year ended June 30, 2012, using comparable prices for similar assets,
resulting in a $220 impairment. Except for these items, there were no significant assets or liabilities that were re-measured at
fair value on a non-recurring basis during the years presented.
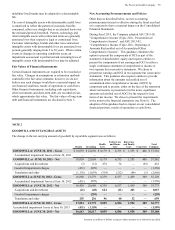
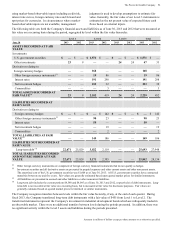
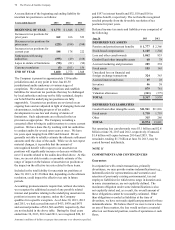
Disclosures about Derivative Instruments
The notional amounts and fair values of qualifying and non-
qualifying financial instruments used in hedging transactions
as of June 30, 2013 and 2012 are as follows:
Notional Amount Fair Value Asset/(Liability)
June 30 2013 2012 2013 2012
DERIVATIVES IN CASH FLOW HEDGING
RELATIONSHIPS
Foreign
currency
contracts $ 951 $ 831 $ 168 $ (142)
DERIVATIVES IN FAIR VALUE HEDGING
RELATIONSHIPS
Interest rate
contracts $ 9,117 $ 10,747 $ 132 $ 298
DERIVATIVES IN NET INVESTMENT HEDGING
RELATIONSHIPS
Net
investment
hedges $ 1,303 $ 1,768 $ 233 $13
DERIVATIVES NOT DESIGNATED AS HEDGING
INSTRUMENTS
Foreign
currency
contracts $ 7,080 $ 13,210 $ (71) $63
Commodity
contracts —125 —1
TOTAL 7,080 13,335 (71) 64
The total notional amount of contracts outstanding at the end
of the period is indicative of the level of the Company's
derivative activity during the period.
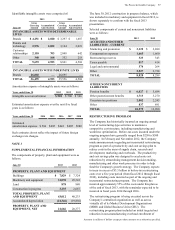
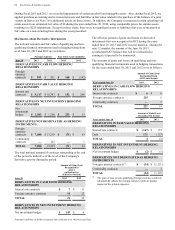
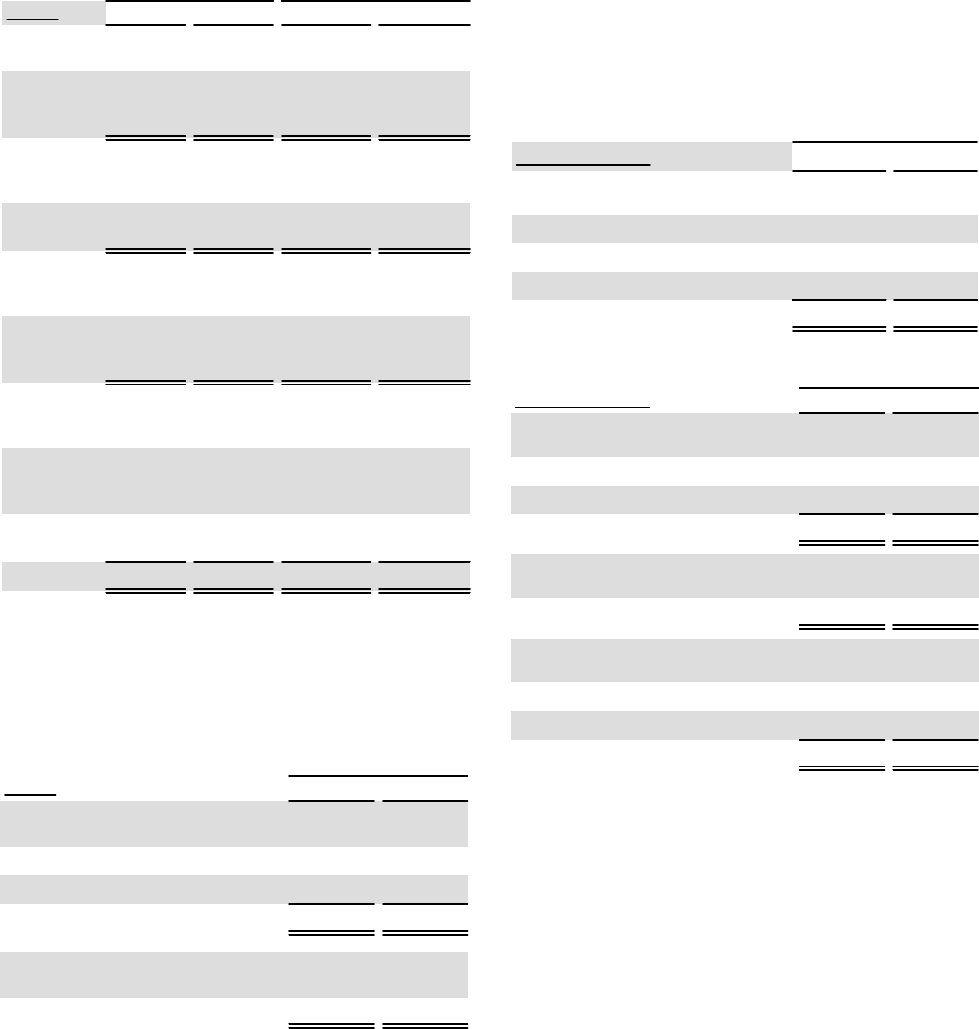
Amount of Gain/(Loss)
Recognized in
AOCI
on Derivatives
(Effective Portion)
June 30 2013 2012
DERIVATIVES IN CASH FLOW HEDGING
RELATIONSHIPS
Interest rate contracts $7
$11
Foreign currency contracts 14 22
TOTAL 21 33
DERIVATIVES IN NET INVESTMENT HEDGING
RELATIONSHIPS
Net investment hedges $ 145 $6
The effective portion of gains and losses on derivative
instruments that was recognized in OCI during the years
ended June 30, 2013 and 2012 was not material. During the
next 12 months, the amount of the June 30, 2013,
accumulated OCI balance that will be reclassified to
earnings is expected to be immaterial.
The amounts of gains and losses on qualifying and non-
qualifying financial instruments used in hedging transactions
for the years ended June 30, 2013 and 2012 were as follows:
Amount of Gain/(Loss)
Reclassified from
AOCI into Income
Years ended June 30 2013 2012
DERIVATIVES IN CASH FLOW HEDGING
RELATIONSHIPS
Interest rate contracts $6
$6
Foreign currency contracts 215 5
Commodity contracts —3
TOTAL 221 14
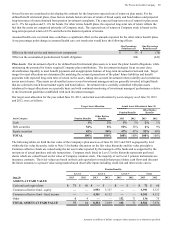
Amount of Gain/(Loss)
Recognized in Income
Years ended June 30 2013 2012
DERIVATIVES IN FAIR VALUE HEDGING
RELATIONSHIPS
Interest rate contracts $ (167) $ 135
Debt 171 (137)
TOTAL 4 (2)
DERIVATIVES IN NET INVESTMENT HEDGING
RELATIONSHIPS
Net investment hedges $(2)
$(1)
DERIVATIVES NOT DESIGNATED AS HEDGING
INSTRUMENTS
Foreign currency contracts(1) $ (34) $ (1,121)
Commodity contracts —2
TOTAL (34) (1,119)
(1) The gain or loss on non-qualifying foreign currency contracts
substantially offsets the foreign currency mark-to-market
impact of the related exposure.