Proctor and Gamble 2013 Annual Report Download - page 39
Download and view the complete annual report
Please find page 39 of the 2013 Proctor and Gamble annual report below. You can navigate through the pages in the report by either clicking on the pages listed below, or by using the keyword search tool below to find specific information within the annual report.-
 1
1 -
2
-
3
-
4
-
5
-
6
-
7
-
8
-
9
-
10
-
11
-
12
-
13
-
14
-
15
-
16
-
17
-
18
-
19
-
20
-
21
-
22
-
23
-
24
-
25
-
26
-
27
-
28
-
 29
29 -
 30
30 -
 31
31 -
 32
32 -
 33
33 -
 34
34 -
 35
35 -
 36
36 -
 37
37 -
 38
38 -
 39
39 -
 40
40 -
 41
41 -
 42
42 -
 43
43 -
 44
44 -
 45
45 -
 46
46 -
 47
47 -
 48
48 -
 49
49 -
50
-
51
-
52
-
53
-
54
-
55
-
56
-
57
-
58
-
59
-
60
-
61
-
62
-
63
-
64
-
65
-
66
-
67
-
68
-
69
-
70
-
71
-
72
-
73
-
74
-
75
-
76
-
77
-
78
-
79
-
80
-
81
-
82
-
83
-
84
-
85
-
86
-
87
-
88
-
89
-
90
-
91
-
92
 |
 |
The Procter & Gamble Company 37
CASH FLOW, FINANCIAL CONDITION AND
LIQUIDITY
We believe our financial condition continues to be of high
quality, as evidenced by our ability to generate substantial
cash from operations and ready access to capital markets at
competitive rates.
Operating cash flow provides the primary source of cash to
fund operating needs and capital expenditures. Excess
operating cash is used first to fund shareholder dividends.
Other discretionary uses include share repurchases and
acquisitions to complement our portfolio of businesses,
brands and geographies. As necessary, we may supplement
operating cash flow with debt to fund these activities. The
overall cash position of the Company reflects our strong
business results and a global cash management strategy that
takes into account liquidity management, economic factors
and tax considerations.
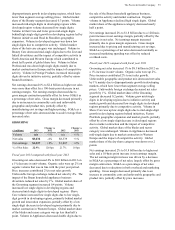
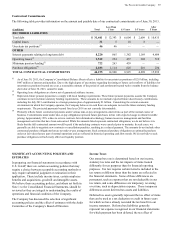
Operating Cash Flow
Fiscal year 2013 compared with fiscal year 2012
Operating cash flow was $14.9 billion in 2013, a 12%
increase from the prior year. Operating cash flows resulted
primarily from net earnings, adjusted for non-cash items
(depreciation and amortization, stock-based compensation,
asset impairments, deferred income taxes and gains on sale
and purchase of businesses) and a decrease in working
capital. Increased accounts receivable used $415 million of
cash primarily to fund growth. In addition, accounts
receivable days sales outstanding increased two days due to
the timing and mix of sales late in the period and foreign
exchange impacts. Increased inventory used $225 million of
cash to support product initiatives and to build stock to
support capacity expansions and manufacturing sourcing
changes, partially offset by inventory management
improvement efforts. Inventory days on hand increased by
one day primarily due to foreign exchange impacts.
Increased accounts payable, accrued and other liabilities
generated $1.3 billion of cash primarily due to an increase in
marketing accruals from increased advertising and other
marketing costs.
Fiscal year 2012 compared with fiscal year 2011
Operating cash flow was $13.3 billion in 2012, in line with
the prior year. Operating cash flows resulted primarily from
net earnings, adjusted for non-cash items (depreciation and
amortization, stock-based compensation, asset impairments,
deferred income taxes and gains on sale of businesses),
partially offset by working capital increases. Increased
accounts receivable used $427 million of cash to fund
growth. However, accounts receivable days sales
outstanding were down two days primarily due to the impact
of foreign exchange. Inventory generated $77 million of
cash, mainly due to an increase in inventory management
improvement efforts, partially offset by inventory to support
product initiatives and to build stock to support capacity
expansions and manufacturing sourcing changes. Inventory
days on hand declined by 10 days primarily due to inventory
management improvement efforts and the impact of foreign
exchange. Accounts payable, accrued and other liabilities
used $22 million of cash, due primarily to the payment of
fines related to violations of the European competition laws.
Cash flow from discontinued operations contributed
approximately $200 million to operating cash flow.
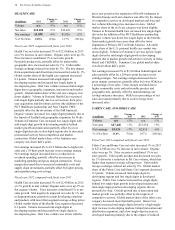
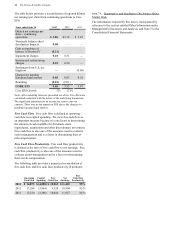
Free Cash Flow. We view free cash flow as an important
measure because it is a factor impacting the amount of cash
available for dividends, share repurchases, acquisitions and
other discretionary investment. It is defined as operating
cash flow less capital expenditures and is one of the
measures used to evaluate senior management and determine
their at-risk compensation.
Fiscal year 2013 compared with fiscal year 2012
Free cash flow was $10.9 billion in 2013, an increase of 17%
versus the prior year. The increase was driven by the
increase in operating cash flows. Free cash flow
productivity, defined as the ratio of free cash flow to net
earnings, was 95% in 2013.
Fiscal year 2012 compared with fiscal year 2011
Free cash flow was $9.3 billion in 2012, a decrease of 7%
versus the prior year. Free cash flow decreased primarily
due to higher capital spending to support geographic
expansion. Free cash flow productivity, defined as the ratio
of free cash flow to net earnings, was 85% in 2012.
Investing Cash Flows
Fiscal year 2013 compared with fiscal year 2012
Net investing activities consumed $6.3 billion in cash in
2013 mainly due to capital spending, cash paid for
acquisitions and investments in available-for-sale securities,
partially offset by asset sales.
Fiscal year 2012 compared with fiscal year 2011
Net investing activities consumed $1.1 billion in cash in
2012 mainly due to capital spending, partially offset by
proceeds from asset sales of $2.9 billion. These proceeds
were primarily related to cash received from the sale of our
snacks business in 2012.
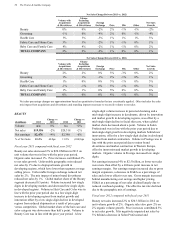
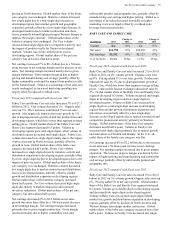
Capital Spending. We manage capital spending to support
our business growth plans and have cost controls to deliver
our cash generation targets. Capital expenditures, primarily
to support capacity expansion, innovation and cost savings,
were $4.0 billion in both 2013 and 2012. Capital spending
as a percentage of net sales increased 10 basis points to 4.8%
in 2013. Capital spending as a percentage of net sales
increased 60 basis points to 4.7% in 2012.
Acquisitions. Acquisitions used $1.1 billion of cash in 2013
primarily for the acquisition of our partner's interest in a
joint venture in Iberia. Acquisitions used $134 million of