Proctor and Gamble 2013 Annual Report Download - page 71
Download and view the complete annual report
Please find page 71 of the 2013 Proctor and Gamble annual report below. You can navigate through the pages in the report by either clicking on the pages listed below, or by using the keyword search tool below to find specific information within the annual report.-
 1
1 -
2
-
3
-
4
-
5
-
6
-
7
-
8
-
9
-
10
-
11
-
12
-
13
-
14
-
15
-
16
-
17
-
18
-
19
-
20
-
21
-
22
-
23
-
24
-
25
-
26
-
27
-
28
-
29
-
30
-
31
-
32
-
33
-
34
-
35
-
36
-
37
-
38
-
39
-
40
-
41
-
42
-
43
-
44
-
45
-
46
-
47
-
48
-
49
-
50
-
51
-
52
-
53
-
54
-
55
-
56
-
57
-
58
-
59
-
60
-
 61
61 -
 62
62 -
 63
63 -
 64
64 -
 65
65 -
 66
66 -
 67
67 -
 68
68 -
 69
69 -
 70
70 -
 71
71 -
 72
72 -
 73
73 -
 74
74 -
 75
75 -
 76
76 -
 77
77 -
 78
78 -
 79
79 -
 80
80 -
 81
81 -
82
-
83
-
84
-
85
-
86
-
87
-
88
-
89
-
90
-
91
-
92
 |
 |

The Procter & Gamble Company 69
Amounts in millions of dollars except per share amounts or as otherwise specified.
Several factors are considered in developing the estimate for the long-term expected rate of return on plan assets. For the
defined benefit retirement plans, these factors include historical rates of return of broad equity and bond indices and projected
long-term rates of return obtained from pension investment consultants. The expected long-term rates of return for plan assets
are 8 - 9% for equities and 5 - 6% for bonds. For other retiree benefit plans, the expected long-term rate of return reflects the
fact that the assets are comprised primarily of Company stock. The expected rate of return on Company stock is based on the
long-term projected return of 8.5% and reflects the historical pattern of returns.
Assumed health care cost trend rates could have a significant effect on the amounts reported for the other retiree benefit plans.
A one percentage point change in assumed health care cost trend rates would have the following effects:
One-Percentage
Point Increase
One-Percentage
Point Decrease
Effect on the total service and interest cost components $ 91 $ (70)
Effect on the accumulated postretirement benefit obligation 806 (643)
Plan Assets. Our investment objective for defined benefit retirement plan assets is to meet the plans' benefit obligations, while
minimizing the potential for future required Company plan contributions. The investment strategies focus on asset class
diversification, liquidity to meet benefit payments and an appropriate balance of long-term investment return and risk. Target
ranges for asset allocations are determined by matching the actuarial projections of the plans' future liabilities and benefit
payments with expected long-term rates of return on the assets, taking into account investment return volatility and correlations
across asset classes. Plan assets are diversified across several investment managers and are generally invested in liquid funds
that are selected to track broad market equity and bond indices. Investment risk is carefully controlled with plan assets
rebalanced to target allocations on a periodic basis and with continual monitoring of investment managers' performance relative
to the investment guidelines established with each investment manager.
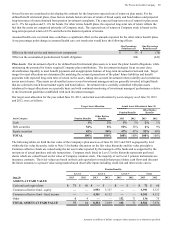
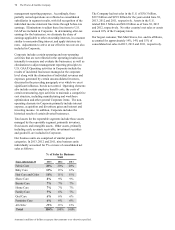
Our target asset allocation for the year ended June 30, 2013, and actual asset allocation by asset category as of June 30, 2013
and 2012, were as follows:
Target Asset Allocation Actual Asset Allocation at June 30
Pension Benefits
Other Retiree
Benefits
Asset Category Pension Benefits
Other Retiree
Benefits 2013 2012 2013 2012
Cash 1% 2% 1% 1% 2% 1%
Debt securities 54% 8% 52% 52% 6% 9%
Equity securities 45% 90% 47% 47% 92% 90%
TOTAL 100% 100% 100% 100% 100% 100%
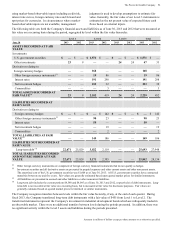
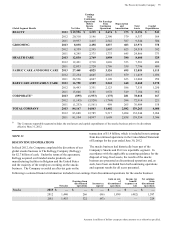
The following tables set forth the fair value of the Company's plan assets as of June 30, 2013 and 2012 segregated by level
within the fair value hierarchy (refer to Note 5 for further discussion on the fair value hierarchy and fair value principles).
Common collective funds are valued using the net asset value reported by the managers of the funds and as supported by the
unit prices of actual purchase and sale transactions. Company stock listed as Level 2 in the hierarchy represents preferred
shares which are valued based on the value of Company common stock. The majority of our Level 3 pension instruments are
insurance contracts. Their fair values are based on their cash equivalent or models that project future cash flows and discount
the future amounts to a present value using market-based observable inputs including credit risk and interest rate curves.
Pension Benefits
Level 1 Level 2 Level 3 Total
June 30 2013 2012 2013 2012 2013 2012 2013 2012
ASSETS AT FAIR VALUE
Cash and cash equivalents $71
$ 60 $—
$ — $—
$ — $71
$ 60
Common collective fund - equity — —
3,993 3,727 — —
3,993 3,727
Common collective fund - fixed income — —
4,361 4,112 — —
4,361 4,112
Other 4 4 —
— 132 71 136 75
TOTAL ASSETS AT FAIR VALUE 75 64
8,354 7,839 132 71
8,561 7,974