Proctor and Gamble 2013 Annual Report Download - page 32
Download and view the complete annual report
Please find page 32 of the 2013 Proctor and Gamble annual report below. You can navigate through the pages in the report by either clicking on the pages listed below, or by using the keyword search tool below to find specific information within the annual report.-
 1
1 -
2
-
3
-
4
-
5
-
6
-
7
-
8
-
9
-
10
-
11
-
12
-
13
-
14
-
15
-
16
-
17
-
18
-
19
-
20
-
21
-
 22
22 -
 23
23 -
 24
24 -
 25
25 -
 26
26 -
 27
27 -
 28
28 -
 29
29 -
 30
30 -
 31
31 -
 32
32 -
 33
33 -
 34
34 -
 35
35 -
 36
36 -
 37
37 -
 38
38 -
 39
39 -
 40
40 -
 41
41 -
 42
42 -
43
-
44
-
45
-
46
-
47
-
48
-
49
-
50
-
51
-
52
-
53
-
54
-
55
-
56
-
57
-
58
-
59
-
60
-
61
-
62
-
63
-
64
-
65
-
66
-
67
-
68
-
69
-
70
-
71
-
72
-
73
-
74
-
75
-
76
-
77
-
78
-
79
-
80
-
81
-
82
-
83
-
84
-
85
-
86
-
87
-
88
-
89
-
90
-
91
-
92
 |
 |
30 The Procter & Gamble Company
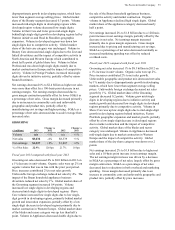
Fiscal year 2012 compared with fiscal year 2011
In 2012, the effective tax rate on continuing operations
increased 510 basis points to 27.1% primarily due to a 250-
basis point impact from the non-deductibility of impairment
charges in fiscal 2012 and the net impact of favorable
discrete adjustments related to uncertain income tax
positions, which drove 250 basis points of the tax rate
difference. The net benefit from favorable discrete
adjustments was $165 million in fiscal 2012, which netted to
130 basis points, versus 380 basis points of net benefits in
fiscal 2011.
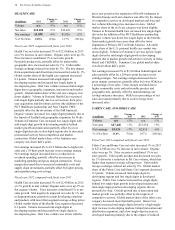
Net Earnings
Fiscal year 2013 compared with fiscal year 2012
Net earnings from continuing operations increased $2.1
billion or 22% to $11.4 billion in 2013. The combination of
the net year-over-year impact of acquisition and divestiture
gains and the net year-over-year decline in impairment
charges drove $1.9 billion of the increase. Earnings also
increased due to the increase in net sales and the 30-basis
point gross margin expansion in the current year.
Net earnings from discontinued operations decreased $1.6
billion in 2013 due to the gain on the divestiture of the
snacks business and the earnings from the snacks business
prior to the divestiture in the prior year period. Net earnings
attributable to Procter & Gamble increased $556 million, or
5% to $11.3 billion.
Diluted net earnings per share from continuing operations
increased 24% to $3.86 due to the increase in net earnings
and a reduction in shares outstanding. The number of shares
outstanding decreased due to $6.0 billion of treasury share
repurchases under our publicly announced share repurchase
program, partially offset by shares issued under share-based
compensation plans. Diluted net earnings per share from
discontinued operations was $0.54 in the prior year period
(zero in the current period) due to the gain on the divestiture
of the snacks business and earnings of the snacks business
prior to the divestiture. Diluted net earnings per share
increased 5% to $3.86.
Core EPS increased 5% to $4.05 primarily due to increased
net sales, gross margin expansion and the reduction in shares
outstanding. Core EPS represents diluted net earnings per
share from continuing operations excluding the current
period charge for the balance sheet impact from the
devaluation of the official foreign exchange rate in
Venezuela, the current year holding gain on the purchase of
the balance of our Iberian joint venture and charges in both
years for European legal matters, incremental restructuring
related to our productivity and cost savings plan and
impairments of goodwill and indefinite-lived intangible
assets.
Fiscal year 2012 compared with fiscal year 2011
In 2012, net earnings from continuing operations decreased
20% to $9.3 billion as an increase in net sales was more than
offset by the impact of impairment charges, incremental
restructuring charges and an increase in income taxes.
Operating margin declined 320 basis points due primarily to
a 190-basis point impact from goodwill and intangible assets
impairment charges in our Appliances and Salon
Professional businesses and an 85-basis point impact from
incremental restructuring charges. The impact of higher
commodity costs and negative product mix was largely
offset by higher pricing, manufacturing cost savings and
increased scale leverage.
Net earnings from discontinued operations increased $1.4
billion in 2012 due to the gain on the divestiture of the
snacks business. Net earnings attributable to Procter &
Gamble declined 9% to $10.8 billion.
Diluted net earnings per share from continuing operations
decreased 19% in 2012 to $3.12 due to the decline in net
earnings, partially offset by a reduction in shares
outstanding. The reduction in the number of shares
outstanding was driven by treasury share repurchases of $4.0
billion, which were made under our publicly announced
share repurchase program, partially offset by shares issued
under share-based compensation plans. Diluted net earnings
per share from discontinued operations increased $0.46 due
to the gain on the divestiture of the snacks business, partially
offset by a decrease in the earnings of the snacks business
prior to the divestiture. Diluted net earnings per share
decreased 7% from the prior year to $3.66 in fiscal 2012.
Core EPS in 2012 decreased 1% to $3.85.
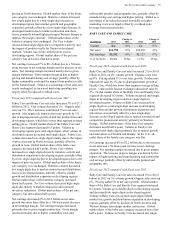
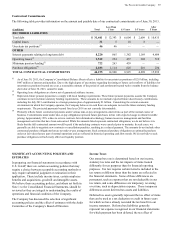
Venezuela Currency Impacts
Venezuela is a highly inflationary economy under U.S.
GAAP. As a result, the U.S. dollar is the functional currency
for our subsidiaries in Venezuela. Any currency
remeasurement adjustments for non-dollar denominated
monetary assets and liabilities held by these subsidiaries and
other transactional foreign exchange gains and losses are
reflected in earnings.
The Venezuelan government has established one official
exchange rate for qualifying dividends and imported goods
and services. That rate was equal to 4.3 Bolivares Fuertes
(VEF) to one U.S. dollar through February 12, 2013.
Effective February 13, 2013, the Venezuelan government
devalued its currency relative to the U.S. dollar from 4.3 to
6.3 (official rate). The remeasurement of our balance sheets
in 2013 to reflect the impact of the devaluation resulted in a
net after-tax charge of $236 million ($0.08 per share). There
will also be an ongoing impact related to translating our
income statement at the new exchange rates. Moving from
the 4.3 rate to the 6.3 rate will reduce future total Company
reported net sales by less than 1% on a going basis. This
does not impact our organic sales growth rate, which
excludes the impact of foreign currency changes. Versus our
existing business plans, the exchange rate change reduced
our reported earnings per share by approximately $0.04 per
share in 2013.