Proctor and Gamble 2013 Annual Report Download - page 2
Download and view the complete annual report
Please find page 2 of the 2013 Proctor and Gamble annual report below. You can navigate through the pages in the report by either clicking on the pages listed below, or by using the keyword search tool below to find specific information within the annual report.-
 1
1 -
 2
2 -
 3
3 -
 4
4 -
 5
5 -
 6
6 -
 7
7 -
 8
8 -
 9
9 -
 10
10 -
 11
11 -
 12
12 -
 13
13 -
14
-
15
-
16
-
17
-
18
-
19
-
20
-
21
-
22
-
23
-
24
-
25
-
26
-
27
-
28
-
29
-
30
-
31
-
32
-
33
-
34
-
35
-
36
-
37
-
38
-
39
-
40
-
41
-
42
-
43
-
44
-
45
-
46
-
47
-
48
-
49
-
50
-
51
-
52
-
53
-
54
-
55
-
56
-
57
-
58
-
59
-
60
-
61
-
62
-
63
-
64
-
65
-
66
-
67
-
68
-
69
-
70
-
71
-
72
-
73
-
74
-
75
-
76
-
77
-
78
-
79
-
80
-
81
-
82
-
83
-
84
-
85
-
86
-
87
-
88
-
89
-
90
-
91
-
92
 |
 |

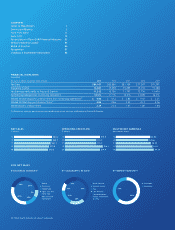
FINANCIAL HIGHLIGHTS
(unaudited)
Amounts in millions, except per share amounts 2013 2012 2011 2010 2009
Net Sales $84,167 $83,680 $81,104 $77,567 $75,295
Operating Income 14,481 13,292 15,495 15,732 15,188
Net Earnings attributable to Procter & Gamble 11,312 10,756 11,797 12,736 13,436
Net Earnings Margin from Continuing Operations 13.5% 11.1% 14.4% 14.0% 14.1%
Diluted Net Earnings per Common Share from Continuing Operations(1) $ 3.86 $ 3.12 $ 3.85 $ 3.47 $ 3.35
Diluted Net Earnings per Common Share(1) 3.86 3.66 3.93 4.11 4.26
Dividends per Common Share 2.29 2.14 1.97 1.80 1.64
() Diluted net earnings per share are calculated based on net earnings attributable to Procter & Gamble.
NET SALES
($ billions)
OPERATING CASH FLOW
($ billions)
DILUTED NET EARNINGS
(per common share)
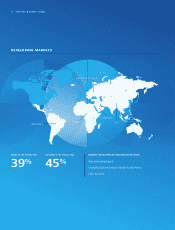
BY BUSINESS SEGMENT(2) BY GEOGRAPHIC REGION BY MARKET MATURITY
.
.
.
.
.
CONTENTS
Letter to Shareholders 1
Sectors and Markets 5
Form 10-K Index 11
Form 10-K 12
Reconciliation of Non-GAAP Financial Measures 85
Global Leadership Council 86
Board of Directors 86
Recognition 87
Company & Shareholder Information 88
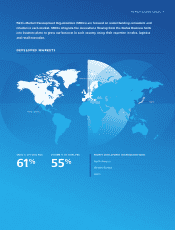
Developed
Developing
NET SALES
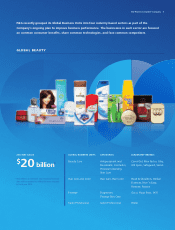
Beauty
Grooming
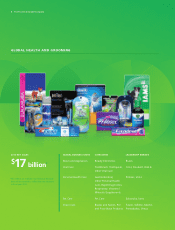
Health Care
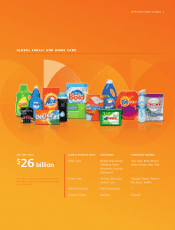
Fabric Care and
Home Care
Baby Care and
Family Care
North America
Western Europe
Asia
Latin America
Central & Eastern
Europe, Middle East
& Africa
9%
32% 15%
20% 24%
18%
15%
18%
10% 39% 39%
61%
.
.
.
.
.
.
.
.
.
.
() These results exclude net sales in Corporate.