Proctor and Gamble 2013 Annual Report Download - page 76
Download and view the complete annual report
Please find page 76 of the 2013 Proctor and Gamble annual report below. You can navigate through the pages in the report by either clicking on the pages listed below, or by using the keyword search tool below to find specific information within the annual report.-
 1
1 -
2
-
3
-
4
-
5
-
6
-
7
-
8
-
9
-
10
-
11
-
12
-
13
-
14
-
15
-
16
-
17
-
18
-
19
-
20
-
21
-
22
-
23
-
24
-
25
-
26
-
27
-
28
-
29
-
30
-
31
-
32
-
33
-
34
-
35
-
36
-
37
-
38
-
39
-
40
-
41
-
42
-
43
-
44
-
45
-
46
-
47
-
48
-
49
-
50
-
51
-
52
-
53
-
54
-
55
-
56
-
57
-
58
-
59
-
60
-
61
-
62
-
63
-
64
-
65
-
 66
66 -
 67
67 -
 68
68 -
 69
69 -
 70
70 -
 71
71 -
 72
72 -
 73
73 -
 74
74 -
 75
75 -
 76
76 -
 77
77 -
 78
78 -
 79
79 -
 80
80 -
 81
81 -
 82
82 -
 83
83 -
 84
84 -
 85
85 -
 86
86 -
87
-
88
-
89
-
90
-
91
-
92
 |
 |
74 The Procter & Gamble Company
Amounts in millions of dollars except per share amounts or as otherwise specified.
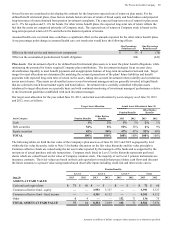
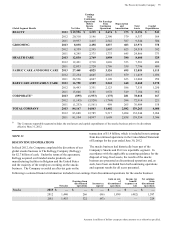
management reporting purposes. Accordingly, these
partially owned operations are reflected as consolidated
subsidiaries in segment results, with full recognition of the
individual income statement line items through before-tax
earnings. Eliminations to adjust these line items to U.S.
GAAP are included in Corporate. In determining after-tax
earnings for the businesses, we eliminate the share of
earnings applicable to other ownership interests, in a manner
similar to noncontrolling interest, and apply statutory tax
rates. Adjustments to arrive at our effective tax rate are also
included in Corporate.
Corporate includes certain operating and non-operating
activities that are not reflected in the operating results used
internally to measure and evaluate the businesses, as well as
eliminations to adjust management reporting principles to
U.S. GAAP. Operating activities in Corporate include the
results of incidental businesses managed at the corporate
level along with the elimination of individual revenues and
expenses generated by certain unconsolidated investees,
discussed in the preceding paragraph, over which we exert
significant influence, but do not control. Operating elements
also include certain employee benefit costs, the costs of
certain restructuring-type activities to maintain a competitive
cost structure, including manufacturing and workforce
optimization and other general Corporate items. The non-
operating elements in Corporate primarily include interest
expense, acquisition and divestiture gains and interest and
investing income. In addition, Corporate includes the
historical results of certain divested businesses.
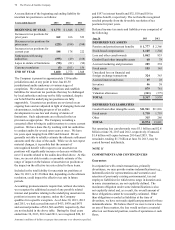
Total assets for the reportable segments include those assets
managed by the reportable segment, primarily inventory,
fixed assets and intangible assets. Other assets, primarily
including cash, accounts receivable, investment securities
and goodwill, are included in Corporate.
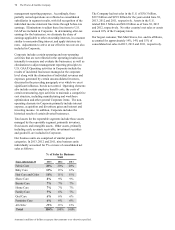
Our business units are comprised of similar product
categories. In 2013, 2012 and 2011, nine business units
individually accounted for 5% or more of consolidated net
sales as follows:
% of Sales by Business
Unit
Years ended June 30 2013 2012 2011
Fabric Care 20% 20% 20%
Baby Care 13% 13% 12%
Hair Care and Color 11% 11% 11%
Shave Care 8% 9% 9%
Beauty Care 7% 7% 7%
Home Care 7% 7% 7%
Family Care 7% 6% 7%
Oral Care 6% 6% 6%
Feminine Care 6% 6% 6%
All Other 15% 15% 15%
Total 100% 100% 100%
The Company had net sales in the U.S. of $30.3 billion,
$29.5 billion and $29.9 billion for the years ended June 30,
2013, 2012 and 2011, respectively. Assets in the U.S.
totaled $68.3 billion and $68.0 billion as of June 30, 2013
and 2012, respectively. No other country's net sales or assets
exceed 10% of the Company totals.
Our largest customer, Wal-Mart Stores, Inc. and its affiliates,
accounted for approximately 14%, 14% and 15% of
consolidated net sales in 2013, 2012 and 2011, respectively.