Proctor and Gamble 2013 Annual Report Download - page 28
Download and view the complete annual report
Please find page 28 of the 2013 Proctor and Gamble annual report below. You can navigate through the pages in the report by either clicking on the pages listed below, or by using the keyword search tool below to find specific information within the annual report.-
 1
1 -
2
-
3
-
4
-
5
-
6
-
7
-
8
-
9
-
10
-
11
-
12
-
13
-
14
-
15
-
16
-
17
-
 18
18 -
 19
19 -
 20
20 -
 21
21 -
 22
22 -
 23
23 -
 24
24 -
 25
25 -
 26
26 -
 27
27 -
 28
28 -
 29
29 -
 30
30 -
 31
31 -
 32
32 -
 33
33 -
 34
34 -
 35
35 -
 36
36 -
 37
37 -
 38
38 -
39
-
40
-
41
-
42
-
43
-
44
-
45
-
46
-
47
-
48
-
49
-
50
-
51
-
52
-
53
-
54
-
55
-
56
-
57
-
58
-
59
-
60
-
61
-
62
-
63
-
64
-
65
-
66
-
67
-
68
-
69
-
70
-
71
-
72
-
73
-
74
-
75
-
76
-
77
-
78
-
79
-
80
-
81
-
82
-
83
-
84
-
85
-
86
-
87
-
88
-
89
-
90
-
91
-
92
 |
 |

26 The Procter & Gamble Company
Finally, we are focused on improving operating discipline in
everything we do. Executing better than our competitors is
how we win with customers and consumers and generate
leadership returns for our shareholders.
Given current market growth rates, the Company expects the
consistent delivery of the following annual financial targets
will result in total shareholder returns in the top third of the
competitive peer group:
• Grow organic sales modestly above market growth
rates in the categories and geographies in which we
compete,
• Deliver Core EPS growth of high single digits, and
• Generate free cash flow productivity of 90% or
greater.
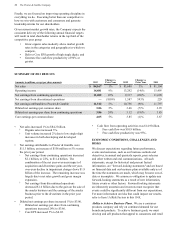
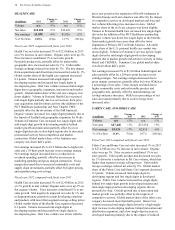
SUMMARY OF 2013 RESULTS
Amounts in millions, except per share amounts 2013
Change vs.
Prior Year 2012
Change vs.
Prior Year 2011
Net sales $ 84,167 1% $ 83,680 3% $ 81,104
Operating income 14,481 9% 13,292 (14)% 15,495
Net earnings from continuing operations 11,402 22% 9,317 (20)% 11,698
Net earnings from discontinued operations —(100)% 1,587 593% 229
Net earnings attributable to Procter & Gamble 11,312 5% 10,756 (9)% 11,797
Diluted net earnings per common share 3.86 5% 3.66 (7)% 3.93
Diluted net earnings per share from continuing operations 3.86 24% 3.12 (19)% 3.85
Core earnings per common share 4.05 5% 3.85 (1)% 3.87
• Net sales increased 1% to $84.2 billion.
Organic sales increased 3%.
Unit volume increased 2% due to low single-digit
increases in both developing and developed
regions.
• Net earnings attributable to Procter & Gamble were
$11.3 billion, an increase of $556 million or 5% versus
the prior year period.
Net earnings from continuing operations increased
$2.1 billion, or 22%, to $11.4 billion. The
combination of the net year-over-year impact of
acquisition and divestiture gains and the net year-
over-year decline in impairment charges drove $1.9
billion of the increase. The remaining increase was
largely due to net sales growth and gross margin
expansion.
Net earnings from discontinued operations
decreased $1.6 billion due to the gain on the sale of
the snacks business and the earnings of the snacks
business prior to the divestiture in the prior year
period.
• Diluted net earnings per share increased 5% to $3.86.
Diluted net earnings per share from continuing
operations increased 24% to $3.86.
Core EPS increased 5% to $4.05.
• Cash flow from operating activities was $14.9 billion.
Free cash flow was $10.9 billion.
Free cash flow productivity was 95%.
ECONOMIC CONDITIONS, CHALLENGES AND
RISKS
We discuss expectations regarding future performance,
events and outcomes, such as our business outlook and
objectives, in annual and quarterly reports, press releases
and other written and oral communications. All such
statements, except for historical and present factual
information, are "forward-looking statements" and are based
on financial data and our business plans available only as of
the time the statements are made, which may become out-of-
date or incomplete. We assume no obligation to update any
forward-looking statements as a result of new information,
future events or other factors. Forward-looking statements
are inherently uncertain and investors must recognize that
events could be significantly different from our expectations.
For more information on risks that could impact our results,
refer to Item 1A Risk Factors in this 10-K.
Ability to Achieve Business Plans. We are a consumer
products company and rely on continued demand for our
brands and products. To achieve business goals, we must
develop and sell products that appeal to consumers and retail